<?xml version="1.0" encoding="utf-8"?><feed xmlns="http://www.w3.org/2005/Atom" ><generator uri="https://jekyllrb.com/" version="4.4.1">Jekyll</generator><link href="https://dev.vourteen14.xyz/feed.xml" rel="self" type="application/atom+xml" /><link href="https://dev.vourteen14.xyz/" rel="alternate" type="text/html" /><updated>2026-08-29T04:27:23+00:00</updated><id>https://dev.vourteen14.xyz/feed.xml</id><title type="html">Angga Suriana</title><subtitle>Engineering notes on infrastructure, DevOps, and systems design.</subtitle><author><name>Angga Suriana</name></author><entry><title type="html">The Simple Questions That Made Me Think Hardest</title><link href="https://dev.vourteen14.xyz/2026/08/07/bar-raiser-interview.html" rel="alternate" type="text/html" title="The Simple Questions That Made Me Think Hardest" /><published>2026-08-07T00:00:00+00:00</published><updated>2026-08-06T17:00:00+00:00</updated><id>https://dev.vourteen14.xyz/2026/08/07/bar-raiser-interview</id><content type="html" xml:base="https://dev.vourteen14.xyz/2026/08/07/bar-raiser-interview.html"><![CDATA[<p>A few days ago I had a conversation I was not expecting to be difficult. It was framed around non-technical topics: how I mentor and influence others, how I learn, how I handle conflicting needs across teams.</p>

<p>I work in infra. My day-to-day is Terraform, node pools, and YAML. I figured this would be a relaxed conversation. It was not. I ended up asking for questions to be repeated more than once, not because they were unclear, but because I genuinely needed time to think.</p>

<p>I am writing this because the reflection itself was worth it, whatever comes next.</p>

<!--more-->

<h2 id="the-cost-reduction-that-took-down-production">The Cost Reduction That Took Down Production</h2>

<p>One story I kept coming back to: a node pool migration I ran for cost reduction. I moved from an expensive node pool to a cheaper one. I knew there was risk. I moved forward anyway.</p>

<p>Production went down. Nearly an entire site.</p>

<p>My initial framing of this story was almost defensive: the company got cost savings, and I got experience handling a real incident. But when I tried to actually say that out loud, I heard how it sounded. Like I was using a small saving to justify a downtime I could have prevented.</p>

<p>The real problem was not that I moved fast. It was that I had no rollback plan. No communication to stakeholders about what might go wrong. I moved because I was confident in myself, not because I had done the math.</p>

<p>If you cannot explain what changed in your process after an incident, the story is not done yet. The incident itself is not proof of growth. What you did differently afterward is.</p>

<h2 id="from-help-me-set-up-mcp-to-something-company-wide">From “Help Me Set Up MCP” to Something Company-Wide</h2>

<p>A lighter story, but with broader reach.</p>

<p>My lead asked for help integrating an MCP server into his Claude Code setup. The scope was personal, just for him.</p>

<p>When I looked at it more carefully, I saw something bigger. The same setup, extended properly, could give non-technical people across the company access to infra and internal tools through natural language in chat, without needing a technical background or waiting on the infra team. So I took it further and integrated it into Google Chat, the tool everyone already uses.</p>

<p>What I took from this: sometimes the gap between a junior and senior move is not about the size of the scope you are handed. It is how far you see from a small one.</p>

<p>There was also a part of this I had to reframe. For something that touched workflows outside my team, I brought my manager in to handle stakeholder communication. My first instinct was to frame that as “coming from me carries less weight.” That framing is off. The better read: it was a strategic choice. I drove the technical side and ran the demo. My manager helped position it at the right level for a broader audience. Different framing, different meaning.</p>

<h2 id="disagreeing-with-enough-data-to-back-it-up">Disagreeing With Enough Data to Back It Up</h2>

<p>The team was planning to migrate from Nginx to HAProxy for ingress. I disagreed. HAProxy uses a single config for all services, so if something breaks, everything breaks. The risk was too high for a decision that, in my view, had been researched too quickly without a proper impact assessment.</p>

<p>I brought my concern to the team lead with a trade-off analysis attached, not just a rejection. And I offered an alternative: stay on Nginx and look for a better solution in parallel.</p>

<p>Disagreement is fine. What makes it constructive is bringing data and an alternative. Without those, it is just friction.</p>

<h2 id="the-question-that-made-me-go-quiet">The Question That Made Me Go Quiet</h2>

<p>A scenario: a small health clinic with self-managed data gets acquired by a large hospital group. They want everything, including patient records, moved to the cloud. There are regulatory concerns around medical data. Nobody on your team has experience in this domain. What do you do?</p>

<p>I answered with a standard approach: assess first, map all services and data, identify what can and cannot move, then execute.</p>

<p>Then the follow-up came: “What would you not touch?”</p>

<p>I went quiet. Asked for it to be repeated. Genuinely needed a moment. I have not worked in a regulated industry, so I was reasoning from principles, not experience. My answer: I would not touch the business processes. Those should stay unchanged. Only where the workloads and data live should move.</p>

<p>Looking back, that answer was not wrong, just too general. What the question was probably pointing at: data with hard regulatory constraints, the most critical and least reversible core systems, or the compliance sign-off that has to happen before anything sensitive gets touched.</p>

<p>But I answered from what I actually know. I would rather give an honest answer from a limited frame than a polished one I do not actually stand behind.</p>

<h2 id="the-shortcut-i-was-afraid-to-admit">The Shortcut I Was Afraid to Admit</h2>

<p>There was a technical task where I had to provision a database service via Infrastructure as Code. When asked what my biggest sacrifice was, I gave the safe answer: time and planning.</p>

<p>The honest answer: I took a shortcut in that repo. I knew it was not best practice. I did it deliberately to hit the deadline.</p>

<p>I was afraid to say it. I thought it would count against me.</p>

<p>I think that was wrong. Acknowledging that you knowingly took a shortcut as a deliberate trade-off for a specific constraint is a stronger signal than a generic answer. It shows you understood the risk. It also gives you a natural opening to explain what the production version would look like.</p>

<p>If you can explain why you made the shortcut and what you would do differently in production, that is judgment. Hiding it is defensiveness.</p>

<h2 id="vendor-speed-as-a-strength-that-can-become-a-habit">Vendor Speed as a Strength That Can Become a Habit</h2>

<p>Most of my career has been at vendors. In that world you learn to move fast. Decisions get made on pattern recognition: “this usually works,” “that should be fine.” There is rarely room for long research cycles.</p>

<p>That skill has real value. But I have started to notice it becoming a default even in situations that deserve more time, more careful thinking about what cannot be undone.</p>

<p>The node pool incident is the clearest example. I moved fast, took a trade-off, and did not think hard enough about the downstream impact.</p>

<p>I want to build the other muscle: the one that slows down on purpose, structures the decision before touching anything, and thinks through reversibility first. That one has not had much room to grow.</p>

<p>Near the end of the conversation I asked directly: if my answer to the clinic scenario was off, what would a better one look like? I was worried that would make me look unsure of myself. It did not. It turned into an actual discussion instead of a one-sided evaluation.</p>

<h2 id="what-stayed-with-me">What Stayed With Me</h2>

<p>An incident story without “and here is what changed afterward” is an unfinished story. The failure is not the point. The process change is.</p>

<p>Disagreement lands when it comes with data and an alternative. Without those, it is just resistance.</p>

<p>Admitting a shortcut is not a weakness, as long as you can explain the trade-off and what production would look like.</p>

<p>Speed is an asset. It becomes a liability when it is the only mode you have.</p>

<p>And it is fine to say “I have not been in that situation, but reasoning from first principles, here is how I would think about it.” That is more useful than a rehearsed answer you do not fully believe.</p>

<p>Sometimes the most valuable thing a hard conversation does is force you to find the gaps in your own thinking. This one did that.</p>]]></content><author><name>Angga Suriana</name></author><category term="career" /><category term="leadership" /><category term="sre" /><summary type="html"><![CDATA[A reflection session with a CTO and VP that forced me to find gaps in my own thinking I did not know were there.]]></summary></entry><entry><title type="html">How I Connected Google Chat to Claude via a Self-Hosted AI API</title><link href="https://dev.vourteen14.xyz/2026/08/04/google-chat-claude-self-hosted-api.html" rel="alternate" type="text/html" title="How I Connected Google Chat to Claude via a Self-Hosted AI API" /><published>2026-08-04T00:00:00+00:00</published><updated>2026-08-03T17:00:00+00:00</updated><id>https://dev.vourteen14.xyz/2026/08/04/google-chat-claude-self-hosted-api</id><content type="html" xml:base="https://dev.vourteen14.xyz/2026/08/04/google-chat-claude-self-hosted-api.html"><![CDATA[<p>The original bot was simple. Slash commands, whitelist check, run some kubectl or MySQL query, return the result. That was the whole thing.</p>

<p>Then someone asked: can I just ask the bot a question? Not a slash command. Just a question, in natural language, inside a Google Chat thread, and get a useful answer back.</p>

<p>That broke what I had.</p>

<!--more-->

<p>What I wanted was specific: manage our Kubernetes cluster from anywhere, including from a phone. No terminal, no SSH, no context-switching to a laptop. Type a message in Google Chat, get a real answer, and keep the conversation going across turns in the same thread.</p>

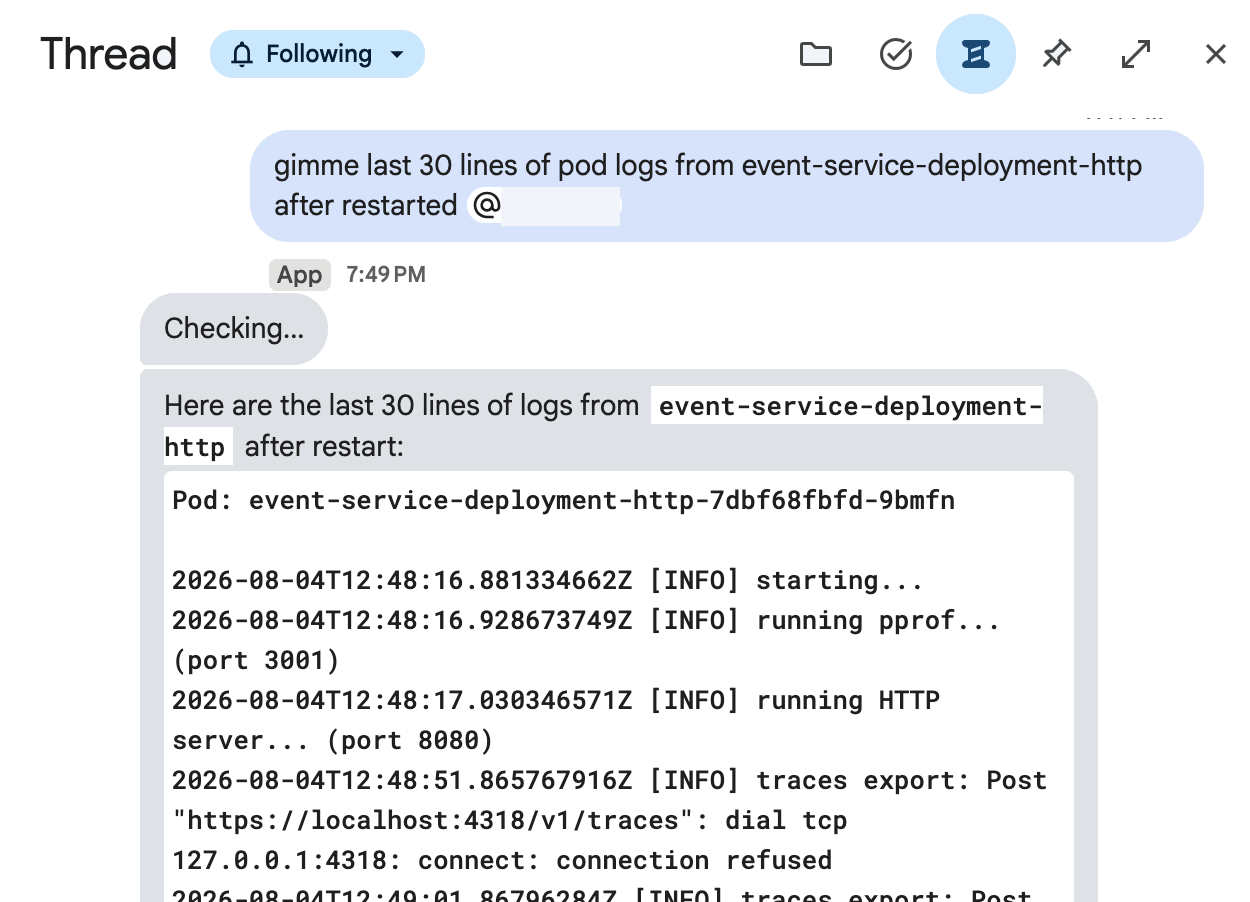
<p>Here is what an actual session looks like:</p>

<p><img src="/assets/image/google-chat-sre-bot-demo.png" alt="Google Chat bot demo — listing namespaces, rolling out a deployment, and reading pod logs in one thread" /></p>

<p>From listing namespaces to rolling out a deployment to reading pod logs, all in one thread, no terminal needed.</p>

<p>Getting there took more than adding an API key.</p>

<h2 id="why-not-just-call-the-api-directly">Why Not Just Call the API Directly</h2>

<p>The obvious move is to call the Anthropic API from the bot. Add a route, drop in an API key, call <code class="language-plaintext highlighter-rouge">completions</code>, return the response. Half an hour of work.</p>

<p>I tried that first and hit three problems pretty fast.</p>

<p><strong>Session continuity.</strong> Google Chat threads are persistent. A conversation might span hours, with different people jumping in. If every message is a fresh API call with no memory of what came before, you basically have a stateless chatbot that forgets everything. I needed conversation state tied to a thread somehow.</p>

<p><strong>Context injection.</strong> The bot already knew things about our infra: namespaces, services, common failure patterns. I wanted Claude to have that context without duplicating it across every caller. Clean injection at request time, not copy-pasted system prompts in three different codebases.</p>

<p><strong>Duplication.</strong> I also maintain a Discord bot with a similar purpose. Every time I wanted to change the model or tweak the system prompt, I was doing it in two places. That gets old fast.</p>

<p>So I put a service in the middle.</p>

<h2 id="what-the-wrapper-does">What the Wrapper Does</h2>

<p>The wrapper is a separate service (TypeScript, Fastify, PostgreSQL) sitting between the bots and Claude. Any client can call it without knowing what is running underneath.</p>

<p>The core endpoint is <code class="language-plaintext highlighter-rouge">/projects/:name/run</code>:</p>

<div class="language-plaintext highlighter-rouge"><div class="highlight"><pre class="highlight"><code>POST /projects/sre-bot/run
X-Api-Key: &lt;project-key&gt;

{
  "prompt": "What's using the most memory in the staging namespace?",
  "session_id": "spaces/XYZ/threads/ABC",
  "timeout": 270
}
</code></pre></div></div>

<p>Response:</p>

<div class="language-json highlighter-rouge"><div class="highlight"><pre class="highlight"><code><span class="p">{</span><span class="w">
  </span><span class="nl">"output"</span><span class="p">:</span><span class="w"> </span><span class="s2">"The top memory consumers in staging are..."</span><span class="p">,</span><span class="w">
  </span><span class="nl">"session_id"</span><span class="p">:</span><span class="w"> </span><span class="s2">"spaces/XYZ/threads/ABC"</span><span class="p">,</span><span class="w">
  </span><span class="nl">"memory_id"</span><span class="p">:</span><span class="w"> </span><span class="mi">4821</span><span class="p">,</span><span class="w">
  </span><span class="nl">"duration_ms"</span><span class="p">:</span><span class="w"> </span><span class="mi">8340</span><span class="w">
</span><span class="p">}</span><span class="w">
</span></code></pre></div></div>

<p>Under the hood, a few things happen that the bot never needs to think about.</p>

<p>Each project has a stored system prompt plus an optional set of skills, which are reusable prompt fragments injected at runtime. The bot project’s system prompt has context about our Kubernetes setup, naming conventions, and what actions are safe to suggest versus what needs explicit confirmation before running.</p>

<p>For session continuity, the wrapper runs Claude Code CLI as a subprocess using <code class="language-plaintext highlighter-rouge">--resume &lt;session_id&gt;</code>. The session ID from the first run becomes the input for the next call. The bot just passes back whatever session ID it last received.</p>

<p>The wrapper also supports two runners: Claude and OpenCode. The project config picks which one. From the bot’s side, the API call looks identical either way, so switching backends is a config change, not a code change.</p>

<p>Every prompt and response gets stored in a <code class="language-plaintext highlighter-rouge">memory</code> table, tied to project and session. That has already come in handy more than once when something unexpected came back and I needed to trace what happened.</p>

<h2 id="how-the-bot-actually-uses-it">How the Bot Actually Uses It</h2>

<p>The bot code is intentionally thin. When a user @mentions the bot or sends a DM without a slash command, the message hits a handler that does exactly three things:</p>

<div class="language-python highlighter-rouge"><div class="highlight"><pre class="highlight"><code><span class="n">session_id</span> <span class="o">=</span> <span class="nf">_load_session_id</span><span class="p">(</span><span class="n">thread_name</span><span class="p">)</span>
<span class="n">reply_text</span><span class="p">,</span> <span class="n">new_session_id</span> <span class="o">=</span> <span class="nf">_call_ai</span><span class="p">(</span><span class="n">user_text</span><span class="p">,</span> <span class="n">session_id</span><span class="p">)</span>
<span class="nf">_save_session_id</span><span class="p">(</span><span class="n">thread_name</span><span class="p">,</span> <span class="n">space_name</span><span class="p">,</span> <span class="n">new_session_id</span><span class="p">)</span>
</code></pre></div></div>

<p>That is the entire integration. Load the session, call the wrapper, save the new session ID. Conversation state lives inside the Claude Code session the wrapper manages, plus a thread-to-session mapping in the bot’s own PostgreSQL database.</p>

<h2 id="session-continuity-in-practice">Session Continuity in Practice</h2>

<p>Sessions are keyed to the Google Chat thread name, which looks like <code class="language-plaintext highlighter-rouge">spaces/SPACE_ID/threads/THREAD_ID</code>. Each thread gets its own conversation, isolated from everything else. When someone comes back to a thread two hours later with a follow-up question, the wrapper resumes the same Claude Code session with full context of what was discussed.</p>

<p>The Discord bot does the same thing, just without delegating to the wrapper. There, the bot manages the session ID itself. Here, it hands that off to the wrapper and just stores a key.</p>

<p>The cost is one extra database roundtrip per message. In practice that is under two milliseconds, completely invisible when the response itself takes 5 to 10 seconds. Worth it to keep the bot code clean.</p>

<h2 id="thread-summarization">Thread Summarization</h2>

<p>One feature that validated the wrapper approach: thread summarization. If someone writes “summarize” or “ringkas” in a message, instead of sending that literally to Claude, the bot fetches the full thread history from the Google Chat API, builds it into a transcript, and sends that as the prompt.</p>

<div class="language-python highlighter-rouge"><div class="highlight"><pre class="highlight"><code><span class="k">if</span> <span class="nf">_is_summarize_request</span><span class="p">(</span><span class="n">user_text</span><span class="p">):</span>
    <span class="n">messages</span> <span class="o">=</span> <span class="nf">list_thread_messages</span><span class="p">(</span><span class="n">space_name</span><span class="p">,</span> <span class="n">thread_name</span><span class="p">)</span>
    <span class="n">prompt</span> <span class="o">=</span> <span class="nf">_build_summarize_prompt</span><span class="p">(</span><span class="n">messages</span><span class="p">)</span>
    <span class="n">reply_text</span><span class="p">,</span> <span class="n">_</span> <span class="o">=</span> <span class="nf">_call_ai</span><span class="p">(</span><span class="n">prompt</span><span class="p">,</span> <span class="n">session_id</span><span class="o">=</span><span class="bp">None</span><span class="p">)</span>
</code></pre></div></div>

<p>The <code class="language-plaintext highlighter-rouge">session_id=None</code> is intentional. A summary is a one-shot thing with no prior context needed, so the wrapper starts fresh. If I had hardwired the Anthropic API into the bot, this would work the same way. But with the wrapper, the summarization prompt and model choice live at the project level. Changing them does not touch the bot.</p>

<h2 id="why-claude-code-cli-instead-of-the-sdk">Why Claude Code CLI Instead of the SDK</h2>

<p>People ask this when I walk through the setup. Why run the CLI as a subprocess rather than just using the SDK?</p>

<p>Claude Code already handles the things I would have to build from scratch: multi-turn conversation state, tool use, context window management, and session continuity with <code class="language-plaintext highlighter-rouge">--resume</code>. When I hand it a prompt via subprocess, I get something that maintains a coherent conversation across calls. The <code class="language-plaintext highlighter-rouge">--output-format json</code> flag keeps the output structured and predictable.</p>

<p>For an internal ops tool, that simplicity is worth more than the control you get from direct API calls. I do not need custom tool definitions or fine-grained context management. I need something that can answer infrastructure questions and occasionally suggest a command that needs a confirmation step before it runs. Claude Code handles that without extra work on my end.</p>

<p>The real trade-off is that the wrapper depends on Claude Code being installed and authenticated on the host. That would be a deal-breaker for a customer-facing product. For an internal tool on a server I already own, it is fine.</p>

<h2 id="the-full-picture">The Full Picture</h2>

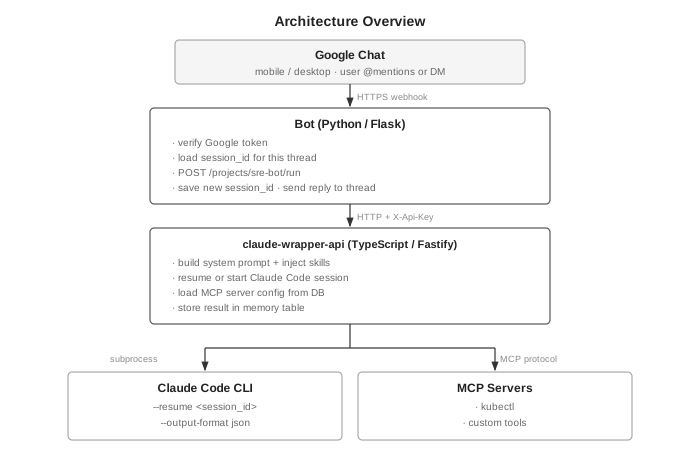
<p>Here is how everything fits together:</p>

<p><img src="/assets/image/google-chat-architecture.svg" alt="Architecture Overview" /></p>

<p>Each Google Chat thread maps to one Claude Code session. The session ID travels from the wrapper to the bot, gets stored in PostgreSQL, and comes back on the next message. The thread is the conversation boundary, persistent and isolated per channel.</p>

<p>The MCP servers are where the actual work happens. The kubectl MCP server is how listing namespaces, rolling out deployments, and reading pod logs actually gets done. Claude figures out what to run, the MCP server executes it, and the result feeds back into the next turn as context.</p>

<h2 id="the-wrapper-as-infrastructure">The Wrapper as Infrastructure</h2>

<p>What makes this setup worth maintaining is that the wrapper is real infrastructure now. It has its own deployment, its own database, its own API keys scoped per project. Adding a new bot means creating a project, writing a system prompt, and pointing at <code class="language-plaintext highlighter-rouge">/projects/:name/run</code>. The AI layer is shared. Project isolation keeps contexts separate.</p>

<p>The Google Chat bot is one project. The Discord bot is another. A Slack or Telegram integration would each get their own project with their own system prompt and session space.</p>

<p>That keeps each bot small. They do not carry any AI logic. Each one is just an interface: take input, call the wrapper, return the output.</p>

<p>There is also a cost angle worth mentioning. Claude Code runs on a subscription, not per-token billing. For the usage pattern of an internal ops bot (a few multi-turn conversations per day, each with tool calls and some reasoning in between), per-token API costs accumulate faster than a flat subscription. With the wrapper, multiple bots share one Claude Code instance. Ten bots pay once, not per token per bot.</p>

<p>I did not design this as a platform from the start. I built the wrapper when I got tired of copying session management code into a second bot. Whether it stays as is or grows into something bigger depends on how many more bots end up pointing at it.</p>]]></content><author><name>Angga Suriana</name></author><category term="sre" /><category term="ai" /><category term="claude" /><category term="devops" /><category term="kubernetes" /><category term="automation" /><category term="google-chat" /><summary type="html"><![CDATA[I built a wrapper API on top of Claude Code CLI so my bot on Google Chat could talk to Claude with persistent sessions, skills, and multi-project isolation — without hardwiring any AI logic into the bot itself.]]></summary></entry><entry><title type="html">Why DevSecOps is the New DevOps in the AI Coding Era</title><link href="https://dev.vourteen14.xyz/2026/05/13/devsecops-ai-coding-era.html" rel="alternate" type="text/html" title="Why DevSecOps is the New DevOps in the AI Coding Era" /><published>2026-05-13T00:00:00+00:00</published><updated>2026-05-12T17:00:00+00:00</updated><id>https://dev.vourteen14.xyz/2026/05/13/devsecops-ai-coding-era</id><content type="html" xml:base="https://dev.vourteen14.xyz/2026/05/13/devsecops-ai-coding-era.html"><![CDATA[<p>We shipped faster with AI. We also shipped a security risk.</p>

<p>That sentence took a while to sit right. For the first few months after the team adopted AI coding assistants into the workflow, everything felt like a win. Pull requests were moving faster. Features that used to take three days were done in one. Someone on the team joked that we had finally become a “10x team.” And statistically, the numbers backed it up. We went from pushing to production roughly once a day to doing it three times.</p>

<p>Nobody stopped to ask whether our security posture had kept up.</p>

<!--more-->

<h2 id="the-problem-nobody-named">The Problem Nobody Named</h2>

<p>Here is the thing about velocity: it does not come with a warning label. When your team starts shipping faster, it feels like progress, because it is. But it also means more code, more dependencies, more configuration files, more credentials, all moving at a pace that humans were not originally designed to review carefully.</p>

<p>Three things broke quietly before we noticed.</p>

<p>The first was secret leakage. Not a dramatic breach, just a developer committing a test config file with a database password baked in. Easy to do when you are moving fast. The password was rotated before anything happened, but only because someone caught it in a peer review two days later. That gap of two days is the problem.</p>

<p>The second was harder to see. Code written with AI assistance is often confidently written. It looks correct. It passes the eye test. But it does not understand your internal security policies, your compliance requirements, or the specific threat model of your system. A function that handles user input might be technically functional and still be missing input validation. A Dockerfile might work perfectly and still be running as root. The code does what it was asked to do. It just was not asked the right questions.</p>

<p>The third was dependency creep. New libraries get suggested, developers install them, and nobody checks CVEs. Not because engineers are careless, but because at 3x velocity, the moment you finish reviewing one new dependency someone else has already merged three more. The surface area of your supply chain quietly expands faster than any human can track manually.</p>

<h2 id="the-devops-question-changed">The DevOps Question Changed</h2>

<p>For most of the last decade, the central DevOps question was: <em>how do we ship faster?</em> Shorter feedback loops. Smaller batches. Continuous deployment. Kill the release bottleneck. The whole discipline was organized around removing friction between code and production.</p>

<p>That question got answered. Faster CI runners, better tooling, leaner review processes. And then AI coding assistants came along and compressed what remained. Suddenly the answer was not just “faster” but “much faster, with fewer people.” The friction mostly disappeared.</p>

<p>Now we are sitting with a follow-up question the original DevOps playbook never fully addressed: <em>how do we ship fast safely?</em></p>

<p>That is not a security team question anymore. It is a DevOps question. Because the bottleneck is no longer deployment frequency. It is the gap between how fast code is being written and how thoroughly it is being checked. If your pipeline was designed around a team that shipped once a day, it was probably fine for engineers to eyeball dependencies and scan configs manually. At 3x velocity with that approach, things start slipping through.</p>

<p>DevSecOps used to feel like a compliance exercise, something you bolted on before an audit. What it actually is, when done right, is the engineering discipline that makes high velocity survivable. The question is not whether to add security to your pipeline. It is how to add it without creating the new bottleneck you spent years trying to remove.</p>

<h2 id="what-the-pipeline-needs-to-look-like">What the Pipeline Needs to Look Like</h2>

<p>The answer is not to slow down. The answer is to build a pre-check zone that runs before your code ever touches CI, a set of automated gates that catch the obvious things so humans can focus on the non-obvious ones.</p>

<p>The flow looks like this:</p>

<div class="language-plaintext highlighter-rouge"><div class="highlight"><pre class="highlight"><code>local commit → pre-commit hooks → push → SAST → SCA → PR gate → deploy
</code></pre></div></div>

<p>Every stage has a job. Pre-commit hooks are your first line: fast, local, zero infrastructure required. SAST catches code-level vulnerabilities before merge. SCA scans your dependency tree for known CVEs. The PR gate is where everything must be green before a human review even begins. Only then does code move toward deployment.</p>

<p>The critical thing is that this is not optional at any stage. A pipeline that only runs SAST in CI but skips pre-commit hooks gives developers an 8-minute feedback loop instead of a 30-second one. That difference changes behavior. People start ignoring the checks.</p>

<h2 id="the-tool-stack">The Tool Stack</h2>

<p>Here is what a practical setup looks like, split into what I consider non-negotiable and what you can add later:</p>

<table>
  <thead>
    <tr>
      <th>Tool</th>
      <th>Category</th>
      <th>Required</th>
      <th>Notes</th>
    </tr>
  </thead>
  <tbody>
    <tr>
      <td>pre-commit</td>
      <td>Framework</td>
      <td>Yes</td>
      <td>Coordinates all local hooks</td>
    </tr>
    <tr>
      <td>gitleaks</td>
      <td>Secret detection</td>
      <td>Yes</td>
      <td>Must run locally AND in CI</td>
    </tr>
    <tr>
      <td>semgrep</td>
      <td>SAST</td>
      <td>Yes</td>
      <td>Catches code-level vulns</td>
    </tr>
    <tr>
      <td>trivy</td>
      <td>SCA / image scan</td>
      <td>Yes</td>
      <td>CVE checks on deps and containers</td>
    </tr>
    <tr>
      <td>commitlint</td>
      <td>Commit hygiene</td>
      <td>Yes</td>
      <td>Enforces consistent commit messages</td>
    </tr>
    <tr>
      <td>detect-secrets</td>
      <td>Secret detection</td>
      <td>Optional</td>
      <td>Complements gitleaks</td>
    </tr>
    <tr>
      <td>hadolint</td>
      <td>Dockerfile linting</td>
      <td>Optional</td>
      <td>If you ship containers</td>
    </tr>
    <tr>
      <td>checkov</td>
      <td>IaC scanning</td>
      <td>Optional</td>
      <td>For Terraform, Helm, K8s manifests</td>
    </tr>
    <tr>
      <td>osv-scanner</td>
      <td>SCA</td>
      <td>Optional</td>
      <td>Google’s alternative to trivy for deps</td>
    </tr>
    <tr>
      <td>snyk</td>
      <td>SCA + monitoring</td>
      <td>Optional</td>
      <td>Better dashboard if you need reporting</td>
    </tr>
  </tbody>
</table>

<p>One thing worth calling out: gitleaks needs to run in two places. Local pre-commit catches secrets before they are ever committed. CI catches anything that slipped through, maybe someone bypassed the hook, maybe they pushed from a machine without the hooks installed. Defense in depth is not paranoia, it is just engineering.</p>

<p>Semgrep is worth spending time on because it is configurable. The default rules cover a lot of ground, but you can write custom rules for your codebase. Things like “never call this internal function without this wrapper” or “always validate input before passing to this library.” That is where the real value shows up at scale.</p>

<h2 id="what-comes-next">What Comes Next</h2>

<p>This is the architecture and the philosophy, the argument for why shifting security left is not just a buzzword but an operational necessity when your team is shipping at high velocity.</p>

<p>In the next article, I will set all of this up from scratch: gitleaks, semgrep, trivy, the whole pipeline, on Jenkins running in Kubernetes. Every config file, every hook, every CI stage. The kind of walkthrough you can actually follow, not just reference.</p>

<p>Because knowing what to build is step one. Building it is the part that matters.</p>]]></content><author><name>Angga Suriana</name></author><category term="devsecops" /><category term="devops" /><category term="security" /><category term="ai" /><category term="cicd" /><category term="pipeline" /><summary type="html"><![CDATA[We shipped faster with AI. We also shipped a security risk. The DevOps question used to be 'how do we ship faster?' and now it's 'how do we ship fast safely?' Here's what that pipeline looks like.]]></summary></entry><entry><title type="html">On-Call Without the Desk</title><link href="https://dev.vourteen14.xyz/2026/05/09/on-call-without-the-desk.html" rel="alternate" type="text/html" title="On-Call Without the Desk" /><published>2026-05-09T00:00:00+00:00</published><updated>2026-05-08T17:00:00+00:00</updated><id>https://dev.vourteen14.xyz/2026/05/09/on-call-without-the-desk</id><content type="html" xml:base="https://dev.vourteen14.xyz/2026/05/09/on-call-without-the-desk.html"><![CDATA[<p>There is a particular kind of anxiety that comes with being a DevOps engineer. Not the kind from outages or failed deployments, though those are present too. The quieter kind. The background hum of knowing that something could break at any moment and that when it does, people will be waiting for you to fix it.</p>

<p>The standard assumption baked into that responsibility is that you will be at your desk. That you have a terminal open, or can get one open quickly. That your laptop is somewhere nearby, that you can SSH into things, run commands, check logs, and do the actual work.</p>

<p>Most of the time that is true. And then sometimes you are on a commute, or standing in a queue, or halfway through a trip with your laptop sitting at home, and a notification arrives telling you something is down.</p>

<!--more-->

<p>That is the problem I was actually trying to solve. Not “how do I automate Kubernetes operations” in the abstract sense, but a much more specific and uncomfortable question: what do I do when I genuinely cannot open a laptop?</p>

<h2 id="why-discord">Why Discord</h2>

<p>The answer I landed on was a Discord bot. Not because it was the most technically interesting choice, but because Discord is already on my phone, the app is solid, and I know it well enough that using it under pressure doesn’t add cognitive load on top of the incident itself.</p>

<p>The threading model turned out to matter more than I expected. Each request from the <code class="language-plaintext highlighter-rouge">/ask</code> command spawns its own thread. That thread becomes the workspace for that specific issue, a contained conversation where the bot can ask clarifying questions, present findings, request confirmation before running anything destructive, and show output from commands. It maps naturally onto how debugging actually works, which is iterative and back and forth, not a single command and a single result.</p>

<p>Telegram would work just as well in principle. I know the API, the bot ecosystem is mature, and the mobile experience is comparable. The honest reason I picked Discord is that it is where my expertise already lives. Telegram is not off the table as a future interface, just not the one I started with.</p>

<p>The goal was simple: something I could operate with one hand, on a bad connection, without needing to context switch into a full terminal session. The interface just needed to be good enough to not be the bottleneck during an incident.</p>

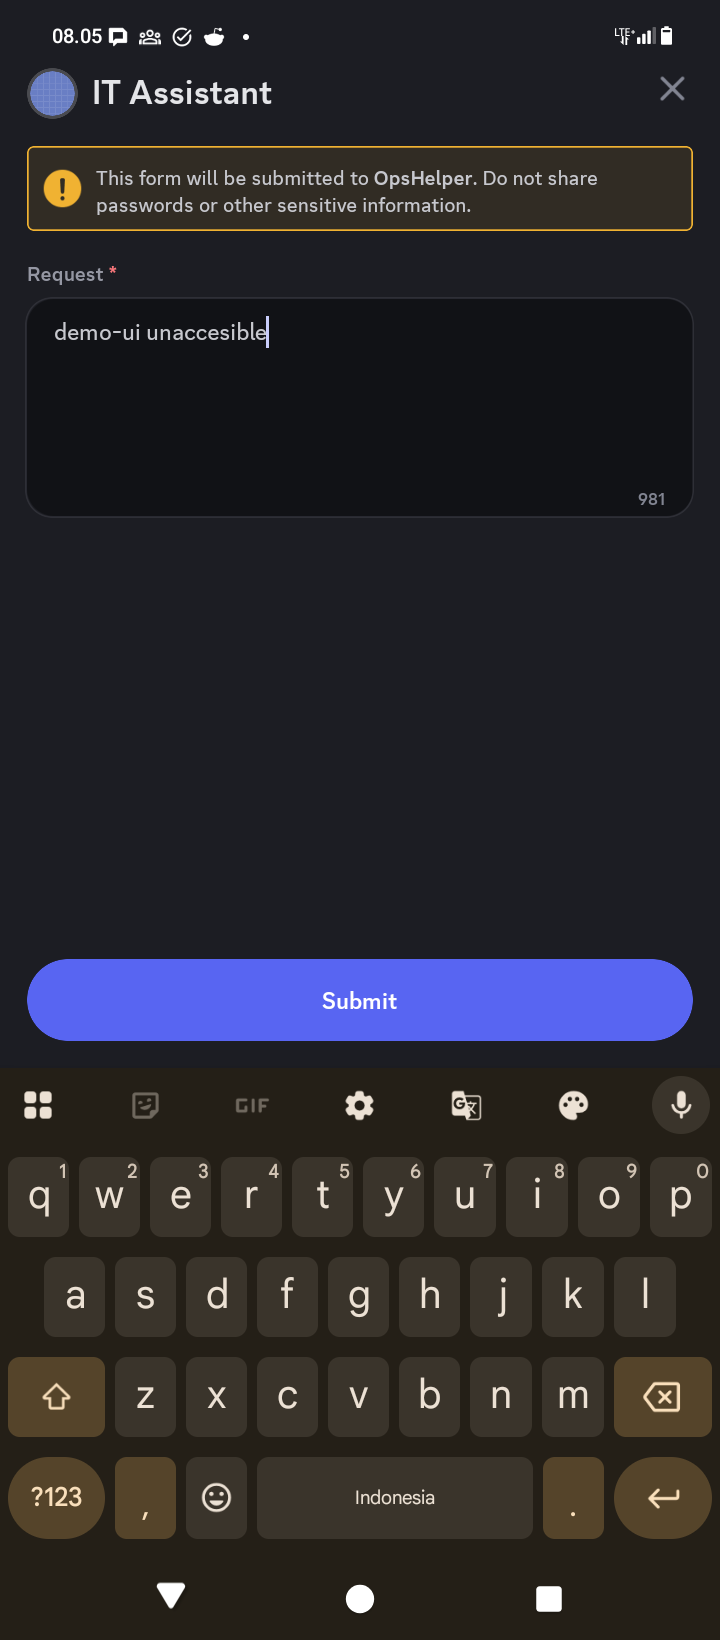
<p><img src="/assets/image/on-call-01.png" alt="IT Assistant modal on Discord" class="mobile-screenshot" /></p>

<h2 id="the-day-demo-ui-went-pending">The Day demo-ui Went Pending</h2>

<p>The first real test came from a report that one of the demo services was inaccessible. The deployment target was Kubernetes, namespace <code class="language-plaintext highlighter-rouge">demo</code>, and the symptom was that the UI was simply not responding. No more detail than that.</p>

<p>The kind of thing that, a few months ago, would have sent me looking for the nearest desk.</p>

<p>Instead, I opened Discord, used <code class="language-plaintext highlighter-rouge">/ask</code>, typed the request into the modal, and submitted it.</p>

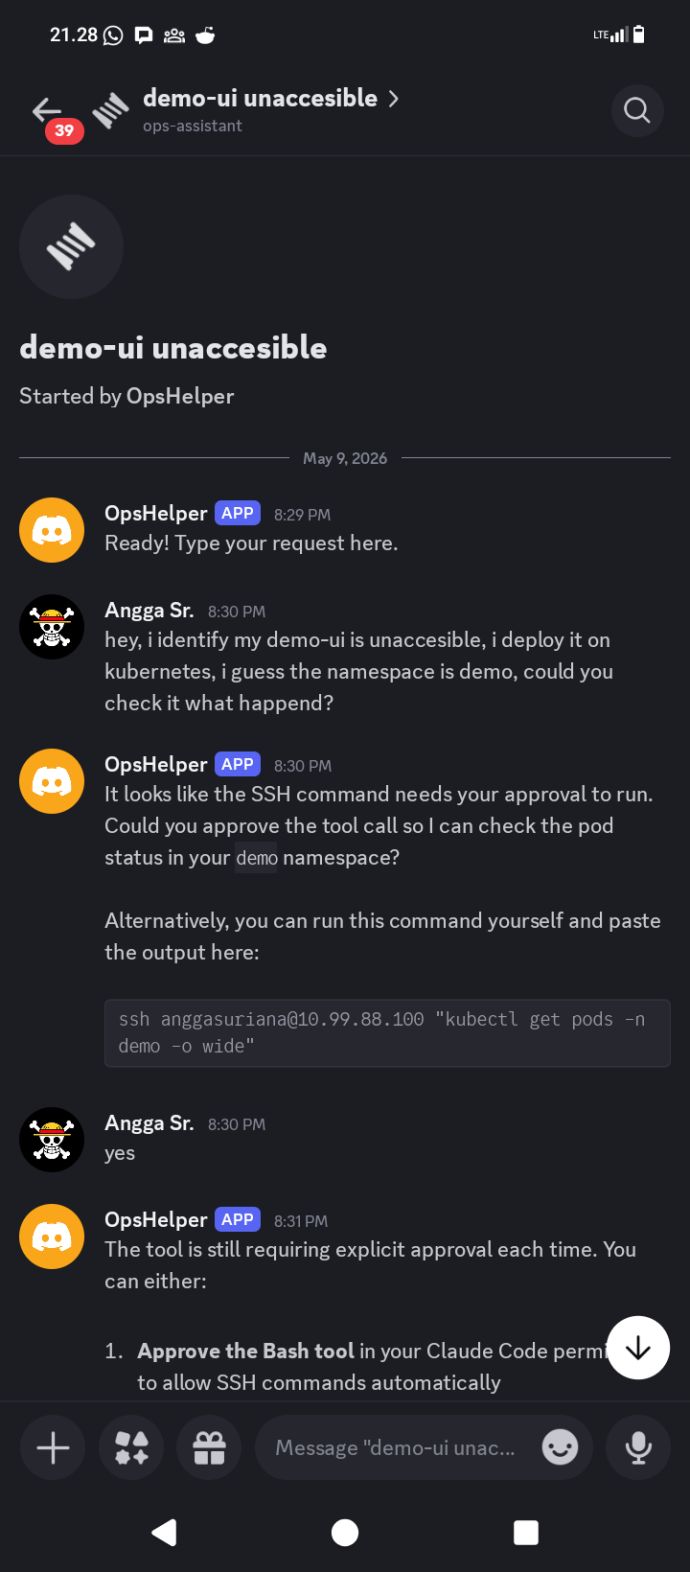
<p><img src="/assets/image/on-call-02.png" alt="Initial investigation in the Discord thread" class="mobile-screenshot" /></p>

<p>The bot asked for approval to SSH into the Kubernetes node and run <code class="language-plaintext highlighter-rouge">kubectl get pods -n demo -o wide</code>. That approval gate is intentional. The bot will not execute shell commands automatically on the first turn. It presents what it wants to run and waits for a yes. Once confirmed, it ran the command and surfaced the result directly in the thread.</p>

<p>The output told the story immediately. <code class="language-plaintext highlighter-rouge">demo-ui-fc8b87b7c-lmtwb</code> was sitting at <code class="language-plaintext highlighter-rouge">0/1 Pending</code>, no node assigned, no IP. Every other service in the namespace was running normally. The scheduler had decided it could not place this pod, and the logs inside the container were irrelevant because the container had never started.</p>

<p>The bot’s interpretation was accurate: no node assigned and no IP means the scheduler cannot place the pod. The next step was to check why.</p>

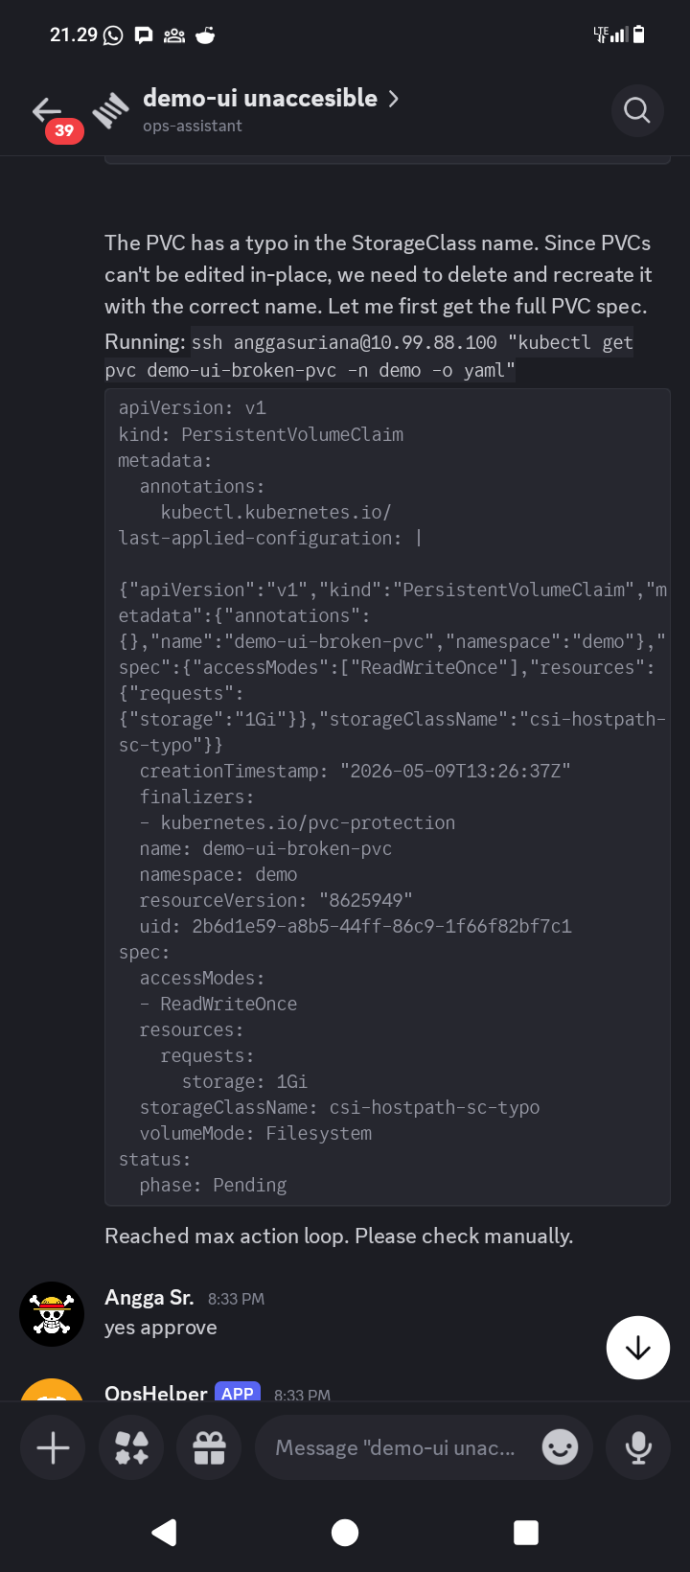
<h2 id="the-root-cause-was-a-typo">The Root Cause Was a Typo</h2>

<p>The bot described the pod, checked its events, and found nothing immediately obvious. It then looked at the PersistentVolumeClaim attached to the deployment.</p>

<p>That is where the problem was.</p>

<p><img src="/assets/image/on-call-03.png" alt="PVC YAML with StorageClass typo and fix proposal" class="mobile-screenshot" /></p>

<p>The PVC named <code class="language-plaintext highlighter-rouge">demo-ui-broken-pvc</code> had <code class="language-plaintext highlighter-rouge">storageClassName: csi-hostpath-sc-typo</code>. The correct StorageClass on the cluster is <code class="language-plaintext highlighter-rouge">csi-hostpath-sc</code>. One extra word, appended to the end of the name, and the scheduler had no idea what to do with the volume claim. The PVC stayed pending. The pod stayed pending. The service stayed down.</p>

<p>Before touching anything, the bot laid out its fix plan:</p>

<ol>
  <li>Delete <code class="language-plaintext highlighter-rouge">demo-ui-broken-pvc</code>, which has the typo in the StorageClass name</li>
  <li>Recreate it with the correct StorageClass <code class="language-plaintext highlighter-rouge">csi-hostpath-sc</code></li>
  <li>The pod will reschedule automatically once the PVC is bound</li>
</ol>

<p>Then it asked for confirmation. Not as a formality. The delete and recreate of a PVC is a meaningful operation and the bot treats it that way. The message ended with “Type yes to proceed or no to cancel.”</p>

<p>That behavior is by design. The system prompt instructs the bot to confirm before anything risky, and deleting storage claims in a Kubernetes namespace qualifies. Getting confirmation wrong in that direction, asking too often, is recoverable. Getting it wrong in the other direction is not.</p>

<h2 id="fixed">Fixed</h2>

<p>After the confirmation, the bot executed the sequence.</p>

<p><img src="/assets/image/on-call-04.png" alt="Pod back up and running" class="mobile-screenshot" /></p>

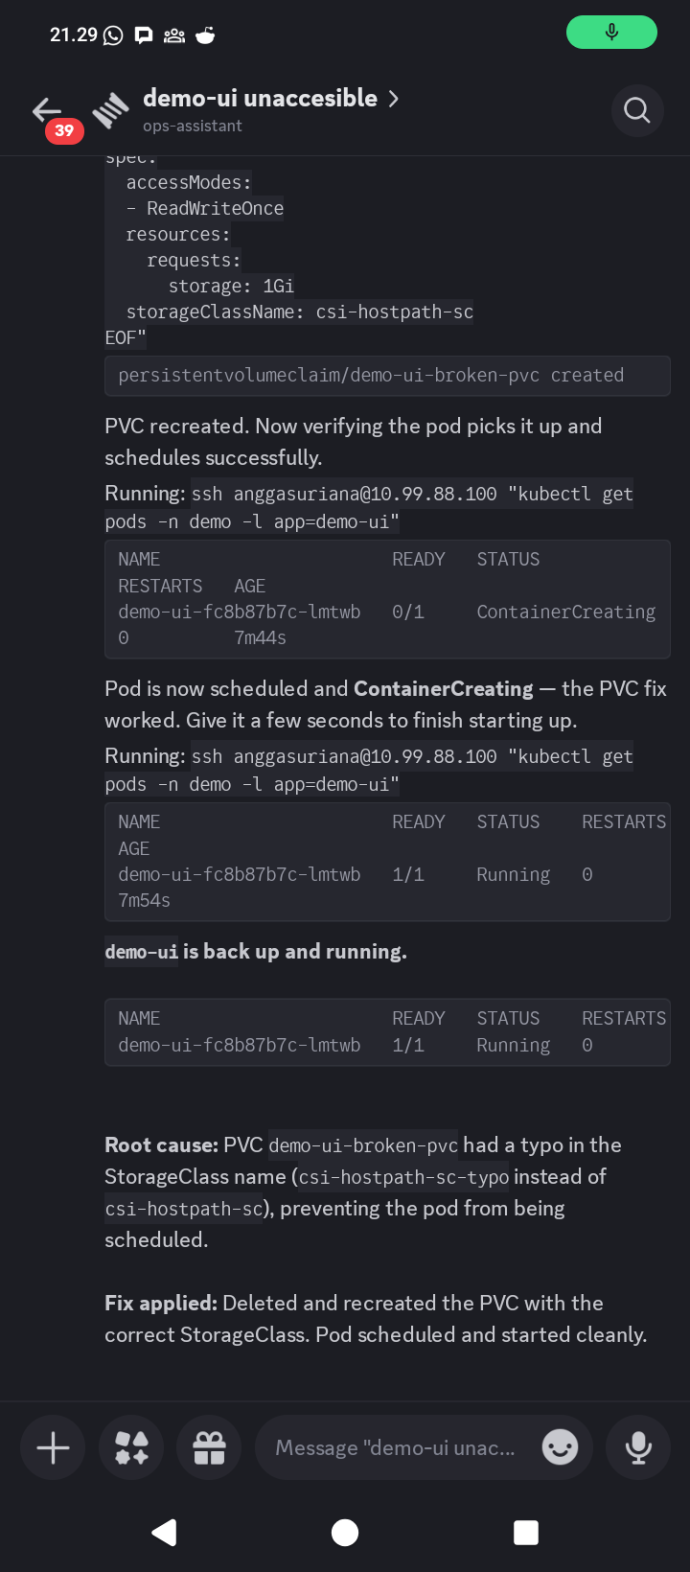
<p>The PVC was deleted and recreated with the correct StorageClass. The bot then watched the pod status as it transitioned from <code class="language-plaintext highlighter-rouge">Pending</code> to <code class="language-plaintext highlighter-rouge">ContainerCreating</code> and then to <code class="language-plaintext highlighter-rouge">Running</code>. The final message in the thread: “demo-ui is back up and running.”</p>

<p>Root cause in the thread summary: PVC <code class="language-plaintext highlighter-rouge">demo-ui-broken-pvc</code> had a typo in the StorageClass name, <code class="language-plaintext highlighter-rouge">csi-hostpath-sc-typo</code> instead of <code class="language-plaintext highlighter-rouge">csi-hostpath-sc</code>, preventing the pod from being scheduled. Fix applied by deleting and recreating the PVC with the correct name. Pod scheduled and started cleanly.</p>

<p>From the first message to resolution, the entire conversation fit in a single Discord thread. I did not open a terminal. I did not SSH into anything manually. I confirmed two things: the initial command approval and the fix.</p>

<h2 id="how-it-actually-works">How It Actually Works</h2>

<p>The tool is around 330 lines of Python spread across a handful of modules. There is no framework doing the heavy lifting. The architecture is straightforward enough to explain in a paragraph.</p>

<p>When a message arrives in a bot-managed thread, the handler builds a prompt by combining a system prompt, an infra runbook with cluster details like node addresses, namespace lists, and common command patterns, and the user’s request. That combined prompt gets passed to the Claude Code CLI via subprocess.</p>

<div class="language-python highlighter-rouge"><div class="highlight"><pre class="highlight"><code><span class="n">cmd</span> <span class="o">=</span> <span class="p">[</span><span class="sh">"</span><span class="s">claude</span><span class="sh">"</span><span class="p">,</span> <span class="sh">"</span><span class="s">-p</span><span class="sh">"</span><span class="p">,</span> <span class="n">prompt</span><span class="p">,</span> <span class="sh">"</span><span class="s">--output-format</span><span class="sh">"</span><span class="p">,</span> <span class="sh">"</span><span class="s">json</span><span class="sh">"</span><span class="p">]</span>
<span class="k">if</span> <span class="n">session_id</span> <span class="ow">and</span> <span class="ow">not</span> <span class="n">is_new</span><span class="p">:</span>
    <span class="n">cmd</span> <span class="o">+=</span> <span class="p">[</span><span class="sh">"</span><span class="s">--resume</span><span class="sh">"</span><span class="p">,</span> <span class="n">session_id</span><span class="p">]</span>
</code></pre></div></div>

<p>The response comes back as JSON. The bot parses it and looks for structured action tags in the text.</p>

<div class="language-python highlighter-rouge"><div class="highlight"><pre class="highlight"><code><span class="n">pattern</span> <span class="o">=</span> <span class="sa">r</span><span class="sh">'</span><span class="s">&lt;action type=</span><span class="sh">"</span><span class="s">(\w+)</span><span class="sh">"</span><span class="s">&gt;(.*?)&lt;/action&gt;</span><span class="sh">'</span>
</code></pre></div></div>

<p>Three action types exist: <code class="language-plaintext highlighter-rouge">execute</code> for shell commands, <code class="language-plaintext highlighter-rouge">confirm</code> for anything destructive, and <code class="language-plaintext highlighter-rouge">input</code> for when the bot needs more information from the user. If none of those tags are present, the response is treated as a plain message and sent directly to the thread. If an <code class="language-plaintext highlighter-rouge">execute</code> tag is found, the shell command inside it runs, the output gets captured, and the next turn passes that output back to Claude as context. That loop runs up to five times before the bot gives up and asks for manual intervention.</p>

<p>Session continuity works through Claude Code’s <code class="language-plaintext highlighter-rouge">--resume</code> flag. The first turn starts a new session and gets back a session ID. Every subsequent message in the same thread resumes that session. The conversation state lives in Claude Code, not in the bot, which keeps the session management trivially simple.</p>

<p><img src="/assets/image/on-call-05.png" alt="Bot running locally with python bot.py" /></p>

<h2 id="the-wrapper-approach">The Wrapper Approach</h2>

<p>The natural question when building something like this is whether to call the Anthropic API directly. It is more control, more flexibility, no dependency on a local binary.</p>

<p>The reason I went the other way is that Claude Code already handles a lot of things that would otherwise require careful implementation. Tool use, context management, prompt formatting, output parsing, the conversation state across turns. When you call the CLI and pass it a prompt, you get a reasoning engine that already knows how to think through multi-step problems. The <code class="language-plaintext highlighter-rouge">--output-format json</code> flag makes the output structured and predictable. The <code class="language-plaintext highlighter-rouge">--resume</code> flag handles session continuity. None of that requires writing a single line of scaffolding.</p>

<p>The trade-off is real. The bot depends on Claude Code being installed and authenticated on the host. You cannot deploy this to a serverless environment or a container that does not have the CLI. The behavior is also less directly controllable than crafting API calls with explicit tool definitions and system prompts baked into the request.</p>

<p>For an internal ops tool running on a machine I already control, those trade-offs are worth it. The complexity that the wrapper approach avoids is more than the flexibility it gives up, at this scale and for this use case. If this ever needed to handle hundreds of concurrent users or run in a managed cloud environment, the calculus would be different. But it does not, and that is fine.</p>

<h2 id="small-by-design">Small by Design</h2>

<p>The 330 lines is not an accident or a sign that the tool is incomplete. It is the result of keeping the scope narrow on purpose.</p>

<p>The bot does not manage deployments. It does not have opinions about your CI pipeline. It does not generate Helm charts or suggest infrastructure improvements or send reports. It answers questions, runs commands you approve, and reports back. That is the entire scope.</p>

<p>Part of why the Claude Code wrapper approach works here is precisely because the intelligence does not need to live in the bot. The bot’s job is to be the interface: take the request, build the context, route the command, return the result. The reasoning, the investigation strategy, the decision about what to look at next, that all lives in Claude. The 330 lines are the plumbing. The thinking is elsewhere.</p>

<p>There is also something honest about keeping it small. A tool you understand completely is a tool you trust in the middle of an incident. When something goes wrong with the bot itself, and it will eventually, I can read the entire codebase in twenty minutes and understand exactly where the failure is. That is not a property you get from a platform.</p>

<p>The original problem was not “I need a powerful automation system.” It was “I need to be able to troubleshoot something from my phone when I am not at a desk.” The tool that solves that problem is one that is always available, easy to invoke, safe enough to use under pressure, and small enough to understand when it misbehaves.</p>

<p>A StorageClass typo kept a service down. A Discord message fixed it. The laptop stayed at home.</p>]]></content><author><name>Angga Suriana</name></author><category term="devops" /><category term="kubernetes" /><category term="discord" /><category term="claude" /><category term="automation" /><category term="ops" /><summary type="html"><![CDATA[I built a Discord bot that wraps Claude Code to troubleshoot Kubernetes issues from my phone. Not because the architecture was elegant, but because I needed something I could use while standing on a train platform.]]></summary></entry><entry><title type="html">The Observability Stack That Couldn’t See Anything</title><link href="https://dev.vourteen14.xyz/2026/05/01/observability-stack-that-couldnt-see-anything.html" rel="alternate" type="text/html" title="The Observability Stack That Couldn’t See Anything" /><published>2026-05-01T00:00:00+00:00</published><updated>2026-04-30T17:00:00+00:00</updated><id>https://dev.vourteen14.xyz/2026/05/01/observability-stack-that-couldnt-see-anything</id><content type="html" xml:base="https://dev.vourteen14.xyz/2026/05/01/observability-stack-that-couldnt-see-anything.html"><![CDATA[<p>The first sign something was wrong wasn’t an alert. It wasn’t a spike in the error rate or a pager going off. It was a message from finance at the end of the month asking why room revenue was lower than expected.</p>

<p>The engineering team pulled up the logs. Order service: <code class="language-plaintext highlighter-rouge">reservation created</code>. Room service: <code class="language-plaintext highlighter-rouge">room assigned</code>. Payment service: <code class="language-plaintext highlighter-rouge">charge processed</code>. Everything green. Every service reporting success. But somehow, users were checking into rooms they hadn’t actually paid for. The money wasn’t there.</p>

<p>Nobody could explain it. Not because the system wasn’t logging, it was. Not because there was no observability stack, there was. Grafana was deployed. Loki was ingesting logs from every service. Tempo was ready for traces. The team had spent two sprints setting it all up and had proudly declared themselves production-ready.</p>

<!--more-->

<p>And when the moment of truth came, they were just as blind as before.</p>

<p>Everything logged. Nothing traced. And somewhere in the gap between those two things, money disappeared.</p>

<h2 id="the-night-finance-asked-a-question-nobody-could-answer">The Night Finance Asked a Question Nobody Could Answer</h2>

<p>Here’s what the investigation actually looked like.</p>

<p>The booking flow spanned three services. A user would place an order, which triggered a room reservation in the inventory service, followed by a payment charge in the payment service. If payment failed, the reservation should roll back. Clean saga pattern, well-designed on paper.</p>

<p>When the team started digging, the logs were technically there. <code class="language-plaintext highlighter-rouge">reservation_id: abc-123</code> in the order service. <code class="language-plaintext highlighter-rouge">room_id: room-42</code> in the inventory service. <code class="language-plaintext highlighter-rouge">transaction_id: txn-789</code> in the payment service. But here’s the problem: those three IDs had no relationship to each other in the log system. There was no way to answer the simplest question in debugging: <em>did these three log entries come from the same user request?</em></p>

<p>What the team actually had was three independent event streams that happened to contain similar timestamps. They couldn’t tell if <code class="language-plaintext highlighter-rouge">txn-789</code> was the payment attempt for <code class="language-plaintext highlighter-rouge">reservation abc-123</code>, or for a completely different booking. They couldn’t reconstruct what happened for any specific user. They couldn’t see whether the rollback ran or silently failed. The fraud detection logic had triggered on certain transactions, causing payment to return an error, but the rollback that should have followed never executed cleanly, and nobody could trace why.</p>

<p>The logs told them what happened inside each box. Nobody had built anything to tell them what happened between the boxes.</p>

<h2 id="logs-are-not-traces">Logs Are Not Traces</h2>

<p>This is the distinction that most teams learn too late, usually in a conversation with finance.</p>

<p>A log entry is a record of something that happened inside one service at one point in time. It’s valuable. It’s necessary. But it’s inherently local, it has no awareness of the larger request it’s part of.</p>

<p>A trace is a record of a single request’s journey across every service it touched, with timing at each step, parent-child relationships between operations, and a single ID that ties everything together. When a user places an order, a distributed trace shows you the HTTP call that came in, the inventory check that happened as a result, the payment attempt that followed, and the rollback that triggered when payment failed, all as one unified story, not three separate entries in three separate log streams.</p>

<p>The difference matters most when things go wrong in between services. Log-based debugging forces you to manually correlate events using timestamps and IDs that your own developers happened to include in log messages. Trace-based debugging shows you the exact path, the exact failure point, and the exact moment the saga broke down.</p>

<p>One is archaeology. The other is a flight recorder.</p>

<h2 id="the-three-piece-puzzle">The Three-Piece Puzzle</h2>

<p>Here’s where teams get burned, and it’s almost never obvious until you’re staring at Tempo wondering why every service has its own separate trace.</p>

<p>OpenTelemetry distributed tracing requires three components to be present simultaneously. Not two. All three. And the frustrating part is that missing any one of them produces no error, no warning, and no indication that anything is wrong. Your metrics still look fine. Your logs still come in. Your traces still appear in Tempo. They’re just all disconnected from each other.</p>

<p>The propagator. This is what teaches OpenTelemetry how to read and write trace context across service boundaries. Without it, every service starts a brand new trace when it receives a request, because it doesn’t know how to look for an existing trace ID in the incoming headers.</p>

<div class="language-go highlighter-rouge"><div class="highlight"><pre class="highlight"><code><span class="n">otel</span><span class="o">.</span><span class="n">SetTextMapPropagator</span><span class="p">(</span><span class="n">propagation</span><span class="o">.</span><span class="n">NewCompositeTextMapPropagator</span><span class="p">(</span>
    <span class="n">propagation</span><span class="o">.</span><span class="n">TraceContext</span><span class="p">{},</span>
    <span class="n">propagation</span><span class="o">.</span><span class="n">Baggage</span><span class="p">{},</span>
<span class="p">))</span>
</code></pre></div></div>

<p>The instrumented HTTP transport. When your service makes an outbound HTTP call to another service, the trace context lives in the Go <code class="language-plaintext highlighter-rouge">context.Context</code> attached to the request. Without an instrumented transport, nothing reads that context and injects the <code class="language-plaintext highlighter-rouge">traceparent</code> header into the outgoing request. The downstream service receives the call with no trace context, so it starts a new trace.</p>

<div class="language-go highlighter-rouge"><div class="highlight"><pre class="highlight"><code><span class="n">http</span><span class="o">.</span><span class="n">Client</span><span class="p">{</span><span class="n">Transport</span><span class="o">:</span> <span class="n">otelhttp</span><span class="o">.</span><span class="n">NewTransport</span><span class="p">(</span><span class="n">http</span><span class="o">.</span><span class="n">DefaultTransport</span><span class="p">)}</span>
</code></pre></div></div>

<p>The server middleware. When your service receives an inbound HTTP request, it needs to extract the trace context from the <code class="language-plaintext highlighter-rouge">traceparent</code> header and attach it to the request context. Without middleware, your handlers have no trace context, so any spans they create float in isolation, disconnected from the upstream caller.</p>

<div class="language-go highlighter-rouge"><div class="highlight"><pre class="highlight"><code><span class="n">r</span><span class="o">.</span><span class="n">Use</span><span class="p">(</span><span class="n">otelgin</span><span class="o">.</span><span class="n">Middleware</span><span class="p">(</span><span class="s">"order-svc"</span><span class="p">))</span>
</code></pre></div></div>

<p>Three pieces. All required. The propagator defines the language. The transport writes it into outbound requests. The middleware reads it from inbound requests. Remove any one of them and you get the worst possible failure mode for an observability tool: it runs silently, produces data, and gives you false confidence that everything is working.</p>

<p>The hotel booking team had deployed OpenTelemetry across all three services. But the payment service was added later by a different developer who didn’t know about the propagator setup. Two services spoke the same tracing language. One didn’t. The result was three islands of telemetry with no bridges between them.</p>

<p>If you want to see these three components wired together end-to-end, I put together a working demo at <a href="https://github.com/vourteen14/grafana-tempo">github.com/vourteen14/grafana-tempo</a> that shows exactly this pattern across three Go services connected to Grafana, Loki, and Tempo. You can reproduce the broken and working state by pulling one of the three components out and watching the traces fall apart.</p>

<h2 id="what-googles-w3c-bet-tells-us">What Google’s W3C Bet Tells Us</h2>

<p>The propagator mechanism isn’t arbitrary. It implements the W3C Trace Context specification, which became an internet standard precisely because distributed tracing kept breaking when different frameworks and vendors used incompatible header formats.</p>

<p>Before standardization, a request leaving a Java service would carry a Zipkin-format trace header. The Python service receiving it wouldn’t recognize the format, would start a fresh trace, and the correlation was lost. Different vendors, different formats, different incompatibilities. Google, Microsoft, and major observability vendors pushed for a single standard because they’d all watched their customers lose trace correlation at service boundaries.</p>

<p>The <code class="language-plaintext highlighter-rouge">traceparent</code> header is what that standardization produced. Every compliant instrumentation library knows how to read it and write it. But “compliant” requires that you explicitly set up the propagator. It doesn’t happen automatically. And because the failure is silent, teams deploy distributed tracing thinking it’s working, run it in production for months, and only discover the broken linkage when they need to debug something specific.</p>

<p>Google’s own Cloud Trace documentation leads with propagation setup. Not metrics. Not dashboards. Propagation. Because without it, nothing else matters.</p>

<h2 id="what-actually-happened-to-the-money">What Actually Happened to the Money</h2>

<p>Once the hotel booking team correctly configured all three components and redeployed, the answer was visible in sixty seconds.</p>

<p>The unified trace showed the full story. An order comes in. Inventory reserves a room, that span is there, with the <code class="language-plaintext highlighter-rouge">reservation_id</code> attached as an attribute. Payment service attempts to charge the card, that span is there too, marked red, with a fraud check event that shows the transaction amount exceeded the card’s fraud limit. Payment returns an error. Back in the order service, the rollback logic runs, but there’s a span marked red there as well, with an event that says <code class="language-plaintext highlighter-rouge">release_reservation_failed: context deadline exceeded</code>.</p>

<p>The rollback was timing out. The room was already assigned. Payment had failed. But the reservation release call was exceeding its timeout, returning silently, and leaving the room in a reserved state. Users could check in because the room showed as reserved in the system. Finance noticed because the payment never cleared.</p>

<p>The bug wasn’t exotic. A missing timeout configuration in the HTTP client used for the rollback call. But finding it without the distributed trace would have taken days, if it was found at all. The logs had all the individual events. None of them could tell you they were part of the same request, or that the rollback that should have followed a payment failure had silently timed out instead.</p>

<h2 id="the-false-confidence-problem">The False Confidence Problem</h2>

<p>There’s a specific kind of blind spot that observability tooling creates when it’s partially broken. It’s worse than having no tooling at all.</p>

<p>When you have nothing, you know you’re flying blind. You build careful logging, you add manual correlation IDs, you trace things through by hand. It’s slow and painful, but you’re aware of your limitations.</p>

<p>When you have a partially broken observability stack, you believe you’re covered. You show stakeholders the Grafana dashboard. You point at the traces in Tempo. You explain that every request is being tracked. You have the confidence of someone who has done the work, except the work has a gap in it that you can’t see, because broken tracing doesn’t announce itself.</p>

<p>This is what makes the three-piece puzzle dangerous. It’s not a misconfiguration that causes errors. It’s a misconfiguration that causes gaps, and gaps are invisible until the exact moment you need the data that should have been in them.</p>

<p>We’ve gotten good at building observability infrastructure. Helm charts, managed collectors, pre-built Grafana dashboards, cloud-native tracing backends. The tooling has never been more accessible. But accessibility makes it easy to go through the motions of observability without achieving it. A deployed OpenTelemetry collector isn’t the same thing as distributed tracing that works. A Tempo datasource in Grafana isn’t the same thing as traces that are connected across your services.</p>

<p>The hotel booking system had every component in place. Prometheus scraping metrics. Loki aggregating logs. Tempo storing traces. OTEL Collector routing everything to the right backend. The team had done everything right in terms of infrastructure, and nothing right in terms of the three lines that actually make distributed tracing work.</p>

<p>Real observability isn’t a stack you deploy. It’s a property your system either has or doesn’t, and the gap between the two can be as small as a missing propagator configuration.</p>

<p>The money disappears quietly. The traces stay disconnected. And the dashboards stay green the whole time.</p>]]></content><author><name>Angga Suriana</name></author><category term="opentelemetry" /><category term="kubernetes" /><category term="observability" /><category term="distributed-tracing" /><category term="microservices" /><summary type="html"><![CDATA[A hotel booking system silently let users check in without collecting payment. Logs were clean, health checks were green, and the observability stack was fully deployed. The problem wasn't the missing monitoring. It was the missing connection between them.]]></summary></entry><entry><title type="html">After the Architect Left, Everything Became Optional</title><link href="https://dev.vourteen14.xyz/2026/03/16/after-the-architect-left.html" rel="alternate" type="text/html" title="After the Architect Left, Everything Became Optional" /><published>2026-03-16T00:00:00+00:00</published><updated>2026-03-15T17:00:00+00:00</updated><id>https://dev.vourteen14.xyz/2026/03/16/after-the-architect-left</id><content type="html" xml:base="https://dev.vourteen14.xyz/2026/03/16/after-the-architect-left.html"><![CDATA[<p>There was a time when the database schema was clean. Table names followed a consistent pattern. Database changes went through a defined process. Developers knew what they were responsible for and where the boundary was. The infrastructure team could manage environments with confidence because what they saw in development roughly resembled what they would see in production.</p>

<p>Then the principal backend left.</p>

<p>Not immediately, not in a single dramatic incident, but gradually. The kind of collapse that you only recognize clearly in hindsight. Standards started becoming suggestions, and suggestions started becoming optional.<!--more--></p>

<h2 id="what-it-looked-like-before">What It Looked Like Before</h2>

<p>When a strong architectural authority is present, a lot of things happen quietly and without much ceremony.</p>

<p>New developers get onboarded into a set of norms that already exist. Naming conventions are established and followed because someone is paying attention. Database changes go through a review process, or at minimum, someone is asking the right questions before anything lands in production. The architecture decisions are made by someone whose job it is to think about the system as a whole, not just the feature they are currently building.</p>

<p>This is not magic. It is the result of someone holding the line on standards consistently enough that the standards start to hold themselves.</p>

<p>Teams under this kind of structure tend to have a certain predictability. The DevOps side of the house can plan around it. Infrastructure tooling is built against known patterns. Migrations are manageable. The gap between development and production environments is narrow, and when it is not, someone notices quickly.</p>

<p>It is easy to take this for granted when it is working.</p>

<h2 id="what-it-looks-like-after">What It Looks Like After</h2>

<p>When that person leaves, the vacuum does not stay empty for long. It gets filled, just not with the same thing.</p>

<p>Individual developers make local decisions. Not out of malice, but because there is no one coordinating the global view. One developer creates a table using snake_case because that is the convention in the language they came from. Another uses camelCase because that is what they are used to. There is no one to say that both of them are wrong, not because of their choice specifically, but because divergence itself is the problem.</p>

<p>Database access becomes informal. Tables get created directly against production-equivalent environments without a clear migration path. Imports happen because someone needs the data right now and the process for doing it properly is unclear or absent. Each individual action is defensible on its own terms. The accumulation is not.</p>

<p>The schema starts to drift. And then the environments start to drift.</p>

<p>This is where it gets expensive.</p>

<h2 id="the-dev-prod-gap">The Dev-Prod Gap</h2>

<p>At some point, the development database and the production database stop being the same thing in different environments. They become different things that happen to share a name.</p>

<p>Column data types diverge. A field that was created as <code class="language-plaintext highlighter-rouge">VARCHAR</code> in one environment exists as <code class="language-plaintext highlighter-rouge">TEXT</code> in another. An integer column in development was backfilled differently in production. A foreign key constraint exists in one place and not the other.</p>

<p>The result is a category of bugs that are genuinely difficult to reason about. Something works correctly in development, passes whatever testing exists, and then behaves differently in production, not because the code is wrong, but because the ground the code is running on is different.</p>

<p>This is the kind of issue that should be caught long before it reaches production. In an environment with proper migration practices and schema versioning, it is caught. In an environment where the database has been managed informally by multiple developers over time, it is a recurring surprise.</p>

<p>The DevOps team, who is responsible for managing these environments, is now operating on infrastructure they cannot fully trust. Every deployment carries a margin of unknown risk. The work of debugging shifts from the development team, where it belongs, to operations, where the blast radius is larger.</p>

<h2 id="the-real-problem-is-structural">The Real Problem Is Structural</h2>

<p>It is tempting to frame this as a people problem. The developers who created inconsistent naming conventions are not bad engineers. The developers who ran informal database imports were not trying to cause problems. They were filling a vacuum the best way they knew how.</p>

<p>The problem is not the people. The problem is the absence of the structure that coordinates the people.</p>

<p>A principal engineer or solution architect is not just a senior developer who codes well. The role carries a specific function in a team’s organizational design: owning the standards, defining the boundaries, making decisions that affect the system as a whole, and critically, being the reason those decisions are consistent over time.</p>

<p>When that role is absent, every developer becomes an implicit architect for the parts of the system they touch. Most developers are not set up to do that job. Not because they lack skill, but because they are optimizing for their immediate task, not for the coherence of the whole system. That is not a failure on their part. It is a predictable outcome of removing the role that was doing that work.</p>

<h2 id="why-it-compounds">Why It Compounds</h2>

<p>The dangerous property of this kind of decay is that it accelerates.</p>

<p>Early inconsistencies are small. A naming convention here, an undocumented table there. The cost of fixing them is low. But they do not get fixed, because there is no one whose job it is to notice them and push back. So they stay, and new inconsistencies are added on top of them.</p>

<p>As the codebase and schema grow, the cost of correcting the foundational issues grows with them. A team that could have spent a few hours standardizing a naming convention six months ago is now looking at a multi-week migration effort that requires coordination across multiple services and careful handling of production data.</p>

<p>The issues that work fine in development but break in production are not isolated incidents. They are symptoms of an environment where the feedback loops that should catch these problems have degraded. They will keep happening, in different forms, until the structural issue is addressed.</p>

<h2 id="what-this-means-for-engineering-managers">What This Means for Engineering Managers</h2>

<p>If you are running an engineering team and you lost your principal engineer or SA, the technical work did not stop needing architectural oversight just because the person providing it is gone.</p>

<p>The question is not whether your team is capable of continuing to ship features. They probably are. The question is whether the decisions being made at the level of system design, conventions, and cross-service boundaries are being made by anyone with a view of the whole.</p>

<p>If the answer is no, the work is still getting done. It is just getting done in a way that will be progressively harder to understand, maintain, and operate.</p>

<p>That cost does not show up immediately on a sprint board. It shows up months later, in production incidents that should not have happened, in onboarding time for new engineers who cannot understand why the schema looks the way it does, and in the infrastructure team spending their time debugging environment drift instead of improving reliability.</p>

<h2 id="what-this-means-for-developers">What This Means for Developers</h2>

<p>If you are a developer on a team without a clear architectural authority, you are probably making more system-level decisions than your role is designed to handle. That is not a criticism. It is a situation you have been placed in.</p>

<p>The decisions you make today about naming, schema design, and how you interact with shared infrastructure will be the baseline that everyone else inherits. The shortcuts that seem harmless in isolation become the patterns that define how the system works.</p>

<p>It is worth asking, before every database change or schema addition, whether someone with a view of the whole system has had a chance to look at it. If there is no one in that role, that is the real problem to surface, not to your codebase, but to whoever is responsible for the engineering organization.</p>

<p>The standards that no one is holding will not hold themselves.</p>]]></content><author><name>Angga Suriana</name></author><category term="engineering" /><category term="culture" /><category term="backend" /><category term="devops" /><category term="architecture" /><summary type="html"><![CDATA[What happens to engineering culture when the principal engineer or solution architect leaves, and why the decay is structural, not personal.]]></summary></entry><entry><title type="html">The HAProxy Ingress Behavior That Broke Our Google SSO in Production</title><link href="https://dev.vourteen14.xyz/2026/03/16/haproxy-backend-snippet-blast-radius.html" rel="alternate" type="text/html" title="The HAProxy Ingress Behavior That Broke Our Google SSO in Production" /><published>2026-03-16T00:00:00+00:00</published><updated>2026-03-15T17:00:00+00:00</updated><id>https://dev.vourteen14.xyz/2026/03/16/haproxy-backend-snippet-blast-radius</id><content type="html" xml:base="https://dev.vourteen14.xyz/2026/03/16/haproxy-backend-snippet-blast-radius.html"><![CDATA[<p>Google OAuth was broken in production. Not intermittently. Completely. Every user who clicked “Login with Google” hit an error page. The callback URL was wrong, NextAuth was rejecting it, and nothing in our recent deployments explained why.</p>

<p>The logs showed a clean 308 redirect. HAProxy was adding a trailing slash to our OAuth callback path. One character, silently appended, was enough to invalidate the entire flow.</p>

<p>What made it worse was that we had not touched the Ingress responsible for that route. No config changes, no deployments to that service, nothing. The Ingress looked exactly as it should.<!--more--></p>

<h2 id="what-actually-happened">What Actually Happened</h2>

<p>OAuth flow depends on exact URL matching. Google redirects the user back to a pre-registered callback URL. If anything changes that URL, even a trailing slash, the provider rejects it.</p>

<p>Our flow was:</p>

<ol>
  <li>User clicks “Login with Google”</li>
  <li>Google redirects back to <code class="language-plaintext highlighter-rouge">/api/auth/callback/google?state=...&amp;code=...</code></li>
  <li>HAProxy intercepts and issues a 308 to <code class="language-plaintext highlighter-rouge">/api/auth/callback/google/</code></li>
  <li>NextAuth receives the modified callback URL and fails with <code class="language-plaintext highlighter-rouge">OAuthCallback</code> error</li>
</ol>

<p>Step three is where everything went wrong. HAProxy was redirecting the OAuth callback with a trailing slash, and the redirect was also dropping the query string. <code class="language-plaintext highlighter-rouge">state</code> and <code class="language-plaintext highlighter-rouge">code</code> parameters, the ones Google sends back to complete the OAuth handshake, were gone.</p>

<p>The redirect rule responsible was in a <code class="language-plaintext highlighter-rouge">backend-config-snippet</code> on an Ingress we had recently updated. But not the Ingress serving the OAuth route. A completely different Ingress, for a completely different domain.</p>

<h2 id="the-behavior-nobody-documents-clearly">The Behavior Nobody Documents Clearly</h2>

<p>HAProxy Ingress Controller merges <code class="language-plaintext highlighter-rouge">backend-config-snippet</code> annotations <strong>per backend service</strong>, not per Ingress resource.</p>

<p>This is the behavior that catches teams off guard. When two or more Ingress resources point to the same Kubernetes Service, every <code class="language-plaintext highlighter-rouge">backend-config-snippet</code> from every one of those Ingresses gets injected into the same backend block in the generated <code class="language-plaintext highlighter-rouge">haproxy.cfg</code>.</p>

<p>To make it concrete:</p>

<div class="language-plaintext highlighter-rouge"><div class="highlight"><pre class="highlight"><code># Ingress A - domain: staging.example.com
backend-config-snippet: |
  http-request redirect code 308 location %[path]/ if !{ path_end / }

# Ingress B - domain: www.example.com
backend-config-snippet: |
  http-request redirect code 308 location %[path]/ if !{ path_end / }

# Both point to: my-app-service
</code></pre></div></div>

<p>What ends up in <code class="language-plaintext highlighter-rouge">haproxy.cfg</code>:</p>

<div class="language-plaintext highlighter-rouge"><div class="highlight"><pre class="highlight"><code>backend my-app-service
  ### injected from Ingress A ###
  http-request redirect code 308 location %[path]/ if !{ path_end / }
  ### injected from Ingress B ###
  http-request redirect code 308 location %[path]/ if !{ path_end / }
</code></pre></div></div>

<p>Both rules are active. Both apply to all traffic hitting that backend, regardless of which domain it came from. Changing one Ingress changes the behavior for traffic from every Ingress that shares the same service.</p>

<p>In our case, a redirect rule on a non-production Ingress was quietly being evaluated against OAuth callbacks on our main domain.</p>

<h2 id="four-things-we-got-wrong">Four Things We Got Wrong</h2>

<p><strong>1. Redirect rules do not belong in <code class="language-plaintext highlighter-rouge">backend-config-snippet</code></strong></p>

<p><code class="language-plaintext highlighter-rouge">http-request</code> redirect rules are meant for the frontend. In HAProxy’s architecture, the frontend evaluates the request before routing it to a backend. That is the right place for redirect logic, before you have committed to a backend, and before the rules from unrelated Ingresses can interfere.</p>

<p>Backend is evaluated after the routing decision. Putting redirects there works, but it means the rule runs in a context shared by every Ingress pointing at that service. Use <code class="language-plaintext highlighter-rouge">haproxy.org/frontend-config-snippet</code> for redirect rules.</p>

<p><strong>2. Every trailing slash redirect needs an <code class="language-plaintext highlighter-rouge">/api</code> exclusion</strong></p>

<p>A redirect rule that catches all paths without exceptions will catch OAuth callbacks, webhook endpoints, and any other API path that cannot tolerate a modified URL.</p>

<div class="language-plaintext highlighter-rouge"><div class="highlight"><pre class="highlight"><code># This will redirect /api/auth/callback/google to /api/auth/callback/google/
http-request redirect code 308 location %[path]/ if !{ path_end / } !{ path_reg \.(js|css|png|jpg|ico|svg|woff2)$ }

# This will not
http-request redirect code 308 location %[path]/?%[query] if !{ path_end / } !{ path_beg /api } !{ path_reg \.(js|css|png|jpg|ico|svg|woff2)$ }
</code></pre></div></div>

<p>Any path under <code class="language-plaintext highlighter-rouge">/api</code> should be excluded from trailing slash redirects. These paths are consumed by code, not browsers. They do not need normalization, and they cannot tolerate unexpected redirects.</p>

<p><strong>3. Never redirect without <code class="language-plaintext highlighter-rouge">%[query]</code></strong></p>

<p><code class="language-plaintext highlighter-rouge">location %[path]/</code> drops the query string. <code class="language-plaintext highlighter-rouge">location %[path]/?%[query]</code> preserves it.</p>

<p>For OAuth, the query string is the entire payload: <code class="language-plaintext highlighter-rouge">state</code>, <code class="language-plaintext highlighter-rouge">code</code>, <code class="language-plaintext highlighter-rouge">session_state</code>. Losing it means the authorization flow is dead on arrival. This is a one-character difference that breaks authentication completely.</p>

<p><strong>4. The Ingress manifest is not the source of truth</strong></p>

<p>Reading the Ingress YAML tells you what you configured. It does not tell you what HAProxy is actually running. The generated <code class="language-plaintext highlighter-rouge">haproxy.cfg</code> is the real source of truth, and it reflects the merged output of every Ingress touching your backend.</p>

<p>When debugging HAProxy behavior, inspect the generated config directly:</p>

<div class="language-bash highlighter-rouge"><div class="highlight"><pre class="highlight"><code>kubectl <span class="nb">exec</span> <span class="nt">-n</span> &lt;haproxy-namespace&gt; &lt;haproxy-pod&gt; <span class="nt">--</span> <span class="nb">cat</span> /etc/haproxy/haproxy.cfg
</code></pre></div></div>

<p>Search for every snippet injected into the backend you care about, not just the ones from the Ingress you edited. That is the only way to see the full picture of what rules are actually evaluating your traffic.</p>

<h2 id="the-blast-radius-of-shared-backends">The Blast Radius of Shared Backends</h2>

<p>The deeper issue here is not the specific redirect rule. It is the implicit coupling that shared backends create in HAProxy.</p>

<p>In NGINX Ingress, each Ingress resource is relatively self-contained. An annotation on one Ingress does not bleed into another. In HAProxy, <code class="language-plaintext highlighter-rouge">backend-config-snippet</code> is pooled. The moment two Ingresses share a backend service, they share a config space. A change on one is a change on both, whether you intended it or not.</p>

<p>This is not a bug; it is a consequence of how HAProxy generates a single unified config file. But it means the operational model is different. You cannot reason about an Ingress in isolation. You have to reason about it in the context of every other Ingress sharing its backend.</p>

<p>Teams that come from NGINX tend to underestimate this. The annotation names look familiar, the concepts seem equivalent, and the differences only show up in production when something unrelated breaks.</p>

<h2 id="haproxy-controller-is-dynamic-and-that-is-the-real-risk">HAProxy Controller Is Dynamic, and That Is the Real Risk</h2>

<p>Everything described so far assumes you made a deliberate change and then something broke. But HAProxy Ingress Controller introduces a subtler risk that deserves its own attention: the controller is fully dynamic.</p>

<p>Every time any Ingress resource in the cluster changes, HAProxy regenerates its entire <code class="language-plaintext highlighter-rouge">haproxy.cfg</code> from scratch and reloads. This includes changes you did not make. A teammate applies an unrelated Ingress update in a different namespace. The controller pod gets restarted due to a node eviction or an OOM kill. A Helm chart upgrade touches a ConfigMap annotation. Any of these events trigger a full config reload, and the resulting config reflects the current state of every Ingress in the cluster at that exact moment.</p>

<p>This means the blast radius of any single change is not limited to the moment it is applied. It persists silently in the config, waiting for the next reload to activate in combination with something else.</p>

<p>The failure pattern is disorienting because there is often no obvious trigger. A service that was working at 2pm stops working at 3pm. No deployment happened to that service. No one touched its Ingress. The on-call engineer checks the usual suspects and finds nothing. What actually happened is that a controller restart re-evaluated the config, and the merged result of some unrelated snippet finally hit the right condition.</p>

<p>This is not hypothetical. It is a real operational pattern that teams running HAProxy Ingress at any meaningful scale will encounter eventually. The controller pod itself becomes a silent failure surface. You cannot reason about what is running in HAProxy without knowing the current merged state of all Ingresses, and that state can change without any intentional action on your part.</p>

<p>The checklist below is not just for when you are about to make a change. It applies any time HAProxy behavior changes unexpectedly. The first question is always: what changed in the generated config, not what changed in the Ingress you are looking at.</p>

<h2 id="checklist-before-applying-ingress-changes-in-haproxy">Checklist Before Applying Ingress Changes in HAProxy</h2>

<p>Before applying any Ingress change that touches <code class="language-plaintext highlighter-rouge">backend-config-snippet</code>:</p>

<ul>
  <li>Find every other Ingress sharing the same backend service: <code class="language-plaintext highlighter-rouge">kubectl get ingress -A -o yaml | grep &lt;service-name&gt;</code></li>
  <li>Inspect the current generated <code class="language-plaintext highlighter-rouge">haproxy.cfg</code> for the affected backend before and after your change</li>
  <li>Confirm every redirect rule excludes <code class="language-plaintext highlighter-rouge">/api</code> paths</li>
  <li>Confirm every redirect rule preserves the query string with <code class="language-plaintext highlighter-rouge">%[query]</code></li>
  <li>Test OAuth and SSO flows in staging before touching production</li>
  <li>Prefer <code class="language-plaintext highlighter-rouge">frontend-config-snippet</code> for redirect rules, because backend snippets should be for backend-specific behavior only</li>
</ul>

<p>The rule that broke our OAuth was not malicious, not careless, and not written by someone who did not know what they were doing. It was written without knowing that HAProxy merges backend snippets across Ingress boundaries. Once you know that, the rest follows.</p>]]></content><author><name>Angga Suriana</name></author><category term="haproxy" /><category term="kubernetes" /><category term="ingress" /><category term="oauth" /><category term="sso" /><summary type="html"><![CDATA[A backend-config-snippet from an unrelated Ingress silently hijacked our OAuth callback and broke Google login. Here is what we found and why HAProxy's shared backend model changes everything.]]></summary></entry><entry><title type="html">What NGINX to HAProxy Migration Taught Us About Config Blast Radius</title><link href="https://dev.vourteen14.xyz/2026/03/02/nginx-to-haproxy-migration.html" rel="alternate" type="text/html" title="What NGINX to HAProxy Migration Taught Us About Config Blast Radius" /><published>2026-03-02T00:00:00+00:00</published><updated>2026-03-01T17:00:00+00:00</updated><id>https://dev.vourteen14.xyz/2026/03/02/nginx-to-haproxy-migration</id><content type="html" xml:base="https://dev.vourteen14.xyz/2026/03/02/nginx-to-haproxy-migration.html"><![CDATA[<p>Switching ingress controllers is not a lift-and-shift operation. NGINX and HAProxy are built on different architectural assumptions, and those differences compound at every layer — from how configuration is loaded to how certificates are selected to how the system behaves when a single rule is malformed.</p>

<p>This is a post-migration review of what we found, what broke, and what needs to be in place before any team runs this in production.<!--more--></p>

<h2 id="executive-summary">Executive Summary</h2>

<table>
  <thead>
    <tr>
      <th>Finding</th>
      <th>Risk</th>
    </tr>
  </thead>
  <tbody>
    <tr>
      <td>Single config file with large blast radius</td>
      <td>High</td>
    </tr>
    <tr>
      <td>TLS certificate update requires pod restart</td>
      <td>Medium</td>
    </tr>
    <tr>
      <td>Certificate priority determined implicitly by secret name ordering</td>
      <td>High</td>
    </tr>
    <tr>
      <td>Advanced regex and rewrite rules not fully supported</td>
      <td>Medium</td>
    </tr>
    <tr>
      <td>All NGINX annotations require manual remapping</td>
      <td>Medium</td>
    </tr>
    <tr>
      <td>Config reload fails entirely on any error</td>
      <td>High</td>
    </tr>
    <tr>
      <td>Observability and debugging are more complex</td>
      <td>Medium</td>
    </tr>
  </tbody>
</table>

<h2 id="the-architectural-divide">The Architectural Divide</h2>

<p>NGINX and HAProxy have fundamentally different design philosophies, and understanding this is the prerequisite for a successful migration.</p>

<p>NGINX is modular, flexible, and L7-heavy. Configuration is split across files, and most behavior can be extended through annotations and server blocks. HAProxy is centralized, high-performance, and rigid. There is one config file, one reload path, and one failure mode when something goes wrong.</p>

<p>Three problem categories define most of the friction in this migration:</p>

<ol>
  <li>Reload and certificate handling</li>
  <li>Blast radius from config centralization</li>
  <li>Feature limitations in regex and annotation support</li>
</ol>

<h2 id="findings">Findings</h2>

<h3 id="tls-certificate-update-requires-pod-restart">TLS Certificate Update Requires Pod Restart</h3>

<p>TLS secret updates are not hot-reloaded by the HAProxy ingress controller. When a certificate is rotated in Kubernetes, the change does not propagate until the HAProxy pod is restarted.</p>

<p>This eliminates the possibility of zero-downtime certificate rotation without additional tooling. During a rolling restart, there is a short window where traffic is handed off between pods, which may cause brief disruption depending on how connections are drained.</p>

<p>The practical implication is that certificate rotation must be treated as a planned operation. Schedule it outside peak traffic, implement <code class="language-plaintext highlighter-rouge">preStop</code> hooks to drain connections gracefully, and verify readiness probes are configured to prevent traffic from hitting a pod before it is ready to serve.</p>

<h3 id="single-configuration-file">Single Configuration File</h3>

<p>All ingress rules are compiled into a single <code class="language-plaintext highlighter-rouge">haproxy.cfg</code>. There is no equivalent to NGINX’s <code class="language-plaintext highlighter-rouge">conf.d/</code> pattern where each domain or service gets its own isolated file.</p>

<p>This matters for failure isolation. In NGINX, a bad config in one file typically prevents that file from loading while leaving the rest untouched. In HAProxy, a single invalid ingress resource causes the entire reload to fail. Every route served by that controller goes down simultaneously.</p>

<p>The blast radius is cluster-wide by default.</p>

<p>Mitigating this requires treating config validation as a mandatory gate. Add <code class="language-plaintext highlighter-rouge">haproxy -c -f haproxy.cfg</code> as a required step in the deployment pipeline before any ingress change is applied. Consider an admission webhook to reject invalid ingress resources at submission time, before they can reach the controller. Replicate the full production ingress config in staging to catch errors before they reach production.</p>

<h3 id="tls-secret-ordering-and-lexicographical-priority">TLS Secret Ordering and Lexicographical Priority</h3>

<p>When multiple certificates cover the same FQDN, HAProxy selects between them based on the lexicographical sort order of the Kubernetes secret name.</p>

<p>This is not surfaced anywhere in the ingress resource definition. The behavior is implicit, undocumented in most operator documentation, and easy to trigger accidentally. Renaming a secret — even to something semantically equivalent — can silently change which certificate is served to end-users. In the worst case, this means serving an expired certificate in production with no configuration change and no visible error.</p>

<p>The fix is enforcing a one-to-one mapping between certificate secrets and FQDNs. Establish a naming convention for TLS secrets and treat deviations as a deployment error. Set up monitoring to compare served certificate CN/SAN values against expected values so any mismatch is caught before users notice.</p>

<h3 id="advanced-regex-not-fully-supported">Advanced Regex Not Fully Supported</h3>

<p>HAProxy does not support complex PCRE patterns. Ingress rules that rely on lookaheads, backreferences, or advanced path rewriting through regex will either fail silently or produce incorrect routing behavior.</p>

<p>NGINX annotations like <code class="language-plaintext highlighter-rouge">nginx.ingress.kubernetes.io/use-regex: "true"</code> combined with complex path patterns have no direct equivalent in HAProxy. Path rewrite capabilities are also more limited.</p>

<p>This needs to be assessed before migration starts, not during. Audit every ingress rule that uses regex and categorize it: can it be simplified into a prefix or exact match, or does the logic need to move into the application layer or an API gateway such as Kong or Envoy? Discovering this mid-cutover creates pressure to push incomplete configurations to production.</p>

<h3 id="annotation-incompatibility">Annotation Incompatibility</h3>

<p>Every <code class="language-plaintext highlighter-rouge">nginx.ingress.kubernetes.io/*</code> annotation is ignored by the HAProxy ingress controller. There is no fallback, no warning, and no partial support. Annotations that have been silently handling SSL redirect, rate limiting, CORS, or custom headers for months simply stop working.</p>

<p>The equivalent annotations exist under the <code class="language-plaintext highlighter-rouge">haproxy.org/*</code> prefix, but behavior is not always semantically equivalent even when the mapping appears straightforward. Connection timeout handling, rewrite behavior, and header forwarding can differ in ways that are only visible under load or in specific edge cases.</p>

<p>Build a reference mapping table of NGINX-to-HAProxy annotations as part of migration prep. Run dry-run deployments and compare observed behavior against expected outcomes systematically across each service before cutover.</p>

<h3 id="config-reload-sensitivity">Config Reload Sensitivity</h3>

<p>HAProxy enforces strict config validation at reload time. Any syntax or semantic error — including errors introduced by a single ingress resource that generates invalid config — causes a complete reload failure with no partial recovery.</p>

<p>NGINX can tolerate some config errors by isolating the affected block. HAProxy cannot. An operator managing 200 ingress rules in a shared cluster has a high-risk surface area. One misconfigured annotation in one team’s ingress definition can prevent all 200 services from updating their routes.</p>

<p>Managing this risk requires the following at minimum: mandatory <code class="language-plaintext highlighter-rouge">haproxy -c</code> validation in the pipeline, canary deployments for high-risk ingress changes, and a known-good config snapshot for fast rollback. Without these, a single bad deploy can take down the entire ingress tier.</p>

<h3 id="observability-and-debugging-complexity">Observability and Debugging Complexity</h3>

<p>HAProxy logs are lower-level and not structured per ingress resource. Diagnosing a routing issue requires manually inspecting the full generated <code class="language-plaintext highlighter-rouge">haproxy.cfg</code> to trace how a request would be matched and forwarded.</p>

<p>Compared to NGINX ingress, where logs are per-request and relatively self-explanatory, debugging HAProxy behavior requires a deeper understanding of the generated config structure and ACL evaluation order. This increases the time to root cause, particularly for engineers who are not familiar with HAProxy internals.</p>

<p>Normalize log output through a parsing layer (Fluentd, Logstash, or similar). Write a troubleshooting runbook that covers the most common failure scenarios: reload failures, certificate mismatches, missing annotation mappings, and ACL evaluation order. Integrate with distributed tracing or APM to close the gap on end-to-end request visibility.</p>

<h2 id="conclusion">Conclusion</h2>

<p>HAProxy is a high-performance proxy with strong operational guarantees. But those guarantees come with a governance model that is stricter than NGINX. Centralized config means higher blast radius. Implicit behaviors around certificate selection and strict reload semantics mean more room for silent failures.</p>

<p>Three areas must be production-ready before cutover:</p>

<ol>
  <li><strong>Config validation pipeline</strong> — mandatory before every ingress change is applied. No exceptions.</li>
  <li><strong>TLS rotation procedure</strong> — documented, tested, and rehearsed with real traffic patterns, not just in theory.</li>
  <li><strong>Full ingress audit</strong> — every regex pattern, annotation mapping, and certificate assignment reviewed individually. Not at a service level. At a rule level.</li>
</ol>

<p>The migration is worth doing if the performance characteristics and load balancing capabilities of HAProxy justify the operational cost. But it is not a default drop-in replacement for NGINX. Treat it as an architectural change, not a configuration swap.</p>]]></content><author><name>Angga Suriana</name></author><category term="kubernetes" /><category term="ingress" /><category term="haproxy" /><category term="nginx" /><category term="migration" /><summary type="html"><![CDATA[A post-migration review of switching from NGINX to HAProxy ingress — covering TLS reload behavior, config blast radius, certificate ordering, and what to test before going live.]]></summary></entry><entry><title type="html">The Open Source Bait and Switch Nobody Talks About</title><link href="https://dev.vourteen14.xyz/2025/12/01/tyk-configmap-controller.html" rel="alternate" type="text/html" title="The Open Source Bait and Switch Nobody Talks About" /><published>2025-12-01T00:00:00+00:00</published><updated>2025-09-06T19:25:52+00:00</updated><id>https://dev.vourteen14.xyz/2025/12/01/tyk-configmap-controller</id><content type="html" xml:base="https://dev.vourteen14.xyz/2025/12/01/tyk-configmap-controller.html"><![CDATA[<p>We needed an API gateway. Kong was $30k/year, AWS API Gateway had its own cost trap. Tyk’s open source gateway looked like the answer: free, performant, written in Go.</p>

<p>The problem was route management. Tyk uses imperative API calls by default, but our infrastructure is fully declarative. Everything lives in Git, deployed with <code class="language-plaintext highlighter-rouge">kubectl apply</code>. We needed an operator.</p>

<p>Tyk has one. It’s called Tyk Operator and it’s exactly what we needed: declarative, GitOps-ready. <!--more--></p>

<p>It’s also enterprise-only.</p>

<p>The open source gateway is free. The tooling that makes it actually usable in a cloud-native setup costs money. Core product free, operational tooling paywalled. So I built my own.</p>

<h2 id="what-i-built">What I Built</h2>

<p><a href="https://github.com/vourteen14/tyk-cm-routes-controller">tyk-cm-routes-controller</a> is 565 lines of Python using Kopf. The idea is straightforward: watch TykRoute custom resources, pull the API definition from the spec, validate it, write it to a ConfigMap as JSON, optionally trigger a rollout restart, and update the resource status. Done.</p>

<p>It worked perfectly in staging with a dozen routes. We shipped it to production.</p>

<p>Eight months later we’d had three production incidents, merge conflicts became a recurring headache, and we kept running into ConfigMap size limits. The gap between “code that works” and “code that works at scale” hit us hard.</p>

<h2 id="the-merge-conflict-problem">The Merge Conflict Problem</h2>

<p>The original design put all routes into a single ConfigMap. Tyk reads route definitions from mounted files at startup, so one ConfigMap with all routes made sense.</p>

<p>It made sense until four teams started deploying independently.</p>

<p>Payments wanted to add a refund endpoint. Products wanted to add an inventory check. Both branched from the same commit. Both modified the same ConfigMap. Git has no idea how to auto-merge 2000 lines of JSON route definitions, so you end up with 57 blobs all marked as conflicting.</p>

<p>An engineer spends 40 minutes resolving it manually. The YAML looks valid, the PR gets approved. Three routes got silently dropped. Six hours later, production starts throwing 404s.</p>

<p>This wasn’t a one-off. The probability of a conflict scales with how often teams deploy. We tried Slack coordination, namespace separation, and not committing the ConfigMap at all. Each workaround introduced a different problem. The root cause was architectural: GitOps assumes independent resources, but a ConfigMap is atomic. The entire object gets versioned as a unit.</p>

<h2 id="race-conditions">Race Conditions</h2>

<p>Kopf gives you three handlers: create, update, delete. Simple enough.</p>

<p>The uniqueness check for <code class="language-plaintext highlighter-rouge">listen_path</code> wasn’t atomic though. The flow was: read the ConfigMap, check if the path already exists, write the new route if it doesn’t. With multiple operator replicas or two TykRoute resources created at the same time, both checks pass before either write completes. You end up with duplicate listen paths in production.</p>

<p>The rollout restart had its own issue. After updating the ConfigMap, the operator would patch the deployment annotations to trigger a restart, then immediately set the TykRoute status to <code class="language-plaintext highlighter-rouge">active</code>. No waiting, no verification. The operator had no idea if the rollout succeeded, if pods were crashlooping, or if Tyk rejected the config.</p>

<p>Fixing this properly would’ve meant integrating with the Tyk admin API, watching rollout status, and adding locking. More complexity, more failure modes. We chose simplicity over robustness.</p>

<h2 id="the-1mb-wall">The 1MB Wall</h2>

<p>Kubernetes has a hard 1MB limit per ConfigMap.</p>

<p>A complex route with auth, rate limiting, transforms, and caching is around 10KB. A simple route is about 2KB. Average maybe 5KB. That gives you roughly 200 routes before you hit the ceiling.</p>

<p>Fine with 12 routes in staging. Not fine when you have an entire API surface spread across multiple teams.</p>

<p>The failure mode is silent until you hit it. Kubernetes rejects the update with a cryptic error. New routes stop working, existing routes keep serving traffic. If nobody’s watching closely, it takes a while to figure out what happened.</p>

<p>The workarounds weren’t great either. Multiple ConfigMaps means multiple volume mounts and complexity that spreads into the Tyk deployment config. Increasing the cluster limit is a non-starter with most platform teams. We ended up with manual capacity planning: monitor the size, split across namespaces when we get close.</p>

<p>Automated route deployment, manual storage capacity planning.</p>

<h2 id="status-that-lies">Status That Lies</h2>

<p>The TykRoute status had fields for <code class="language-plaintext highlighter-rouge">state</code>, <code class="language-plaintext highlighter-rouge">listenPath</code>, <code class="language-plaintext highlighter-rouge">targetConfigMap</code>, and <code class="language-plaintext highlighter-rouge">conditions</code>. When you looked at a route and saw <code class="language-plaintext highlighter-rouge">state: active</code>, it meant the ConfigMap update succeeded.</p>

<p>It did not mean the route was serving traffic.</p>

<p>A rollout could’ve failed. Pods could be crashlooping. Tyk could’ve rejected the config entirely. The operator only knew about the ConfigMap write. The deployment pipeline saw <code class="language-plaintext highlighter-rouge">active</code> and marked success. Monitoring saw <code class="language-plaintext highlighter-rouge">active</code> and stayed quiet. Meanwhile, requests were hitting 404s.</p>

<p>Real status would require integrating with the Tyk admin API, watching rollout completion, and running health checks against the routes. That’s a much bigger project, and we chose not to do it. The operator reports what it knows, which turns out not to be what operators actually need to know.</p>

<h2 id="what-tyk-enterprise-probably-does">What Tyk Enterprise Probably Does</h2>

<p>I can’t say for certain, but the problems we hit are obvious enough that a real product would’ve had to solve them. Probably database writes instead of a single ConfigMap. Actual Tyk API integration so status reflects real availability. Some mechanism for teams to deploy independently without merge conflicts.</p>

<p>The quality gap between a weekend project and production-grade tooling is real and expected.</p>

<h2 id="the-trap">The Trap</h2>

<p>The pattern is predictable in hindsight. Choose open source to avoid the licensing cost. Discover that production use requires the paywalled tooling. By then you’re already committed to the technology. So you build it yourself.</p>

<p>A PoC is a weekend. Production-grade with all the edge cases is a different story. Maintenance over time is harder still.</p>

<p>The comparison spreadsheet made it look obvious: Enterprise at $30k/year versus operator at $0/year. The spreadsheet didn’t have a line for engineering time spent building, debugging, explaining limitations, fielding questions, and responding to incidents. At market rate for a senior engineer, that time adds up past the license cost quickly.</p>

<p>Engineering time doesn’t show up as an incremental cost on budgets the way a vendor invoice does. The CFO sees infrastructure cost down and doesn’t see velocity down. By the time the productivity drag is obvious, you’re maintaining critical infrastructure and the migration cost is high enough that you just keep going.</p>

<p>Tyk’s setup is well-designed for this. The gateway itself is solid and production-ready. The gaps only appear when you start doing K8s-native workflows. By then, traffic is flowing through it, teams depend on it, and migration is a serious project.</p>

<p>We saved the license cost and inherited the development and maintenance cost. Eight months in, I’m not sure we came out ahead.</p>

<h2 id="what-id-think-about-differently">What I’d Think About Differently</h2>

<p>Don’t use a single ConfigMap for data that grows without a bound. Don’t report state as active when you’ve only verified the config write. Coordination logic that works for one team breaks for multiple teams in ways that aren’t obvious until you’re in it.</p>

<p>More importantly: “can we build this” is the wrong question. The right question is whether the operational burden is worth the cost savings. Sometimes the answer is yes, especially when the commercial tool genuinely doesn’t fit your requirements or you have real spare capacity. But when a commercial tool exists and has broad adoption, it usually exists because the problem is harder than it looks. The price reflects engineering effort that’s already been spent solving problems you haven’t hit yet.</p>

<p>For <a href="https://github.com/vourteen14/tyk-cm-routes-controller">tyk-cm-routes-controller</a>: the routes work and the workflow is declarative. But merge conflicts are a recurring tax, the size limit requires manual management, the status is misleading, and every edge case requires manual verification. Fixing the design problems properly would take weeks of work.</p>

<p>We built it to save money. We might have.</p>]]></content><author><name>Angga Suriana</name></author><category term="gke" /><category term="kubernetes" /><category term="tyk" /><category term="api-gateway" /><summary type="html"><![CDATA[Tyk's open source gateway looked like the answer until we found the operator was enterprise-only. Here is how we built a lightweight ConfigMap controller instead.]]></summary></entry><entry><title type="html">Why Auto-Upgrade is Playing Russian Roulette With Your Uptime</title><link href="https://dev.vourteen14.xyz/2025/10/20/auto-upgrade-nighmare.html" rel="alternate" type="text/html" title="Why Auto-Upgrade is Playing Russian Roulette With Your Uptime" /><published>2025-10-20T00:00:00+00:00</published><updated>2025-09-06T19:25:52+00:00</updated><id>https://dev.vourteen14.xyz/2025/10/20/auto-upgrade-nighmare</id><content type="html" xml:base="https://dev.vourteen14.xyz/2025/10/20/auto-upgrade-nighmare.html"><![CDATA[<p>The alert sound is burned into my brain now. That specific PagerDuty tone that means something is <em>really</em> wrong. Not “a pod restarted” wrong. Not “latency spike” wrong. The kind of wrong that makes your stomach drop before you even look at your phone.</p>

<p>Late Sunday night. I’d finally convinced myself to stop checking Slack every five minutes and actually relax. Big mistake. <!--more--></p>

<p>By the time I grabbed my laptop, there were 47 unread messages. The monitoring dashboard looked like someone had taken a red marker to it. Every Kafka metric flatlined. Zero brokers available. Zero partitions healthy. Consumer lag climbing into millions. And the beautiful part? Every single health check for services that touched Kafka, which was basically our entire platform, turning red in a cascading wave of failure.</p>

<p>My first thought was “What did we deploy?”</p>

<p>We deployed nothing. It was Sunday night. Nobody deploys on Sunday night. That’s the rule.</p>

<p>My second thought, after SSHing into the cluster was “This doesn’t make any sense.”</p>

<p>The Kafka pods existed. The ZooKeeper ensemble was running. Storage volumes intact. Network connectivity fine. I could curl the broker endpoints. I could see the processes running. Everything was <em>there</em>, just not working. Like walking into your house and finding all your furniture rearranged by ghosts.</p>

<p>The Strimzi operator logs weren’t helpful. Just an endless loop of the same error, over and over.</p>

<div class="language-plaintext highlighter-rouge"><div class="highlight"><pre class="highlight"><code>ERROR PlatformFeaturesAvailability:138 - Detection of Kubernetes version failed.
</code></pre></div></div>

<p>Kubernetes version detection? What does that have to do with Kafka being down?</p>

<p>I refreshed the GKE console. Cluster status healthy. Recent changes showed one automated upgrade to version 1.33, completed hours earlier.</p>

<p>Oh.</p>

<p><strong>Oh no!!</strong></p>

<h2 id="how-we-got-here">How We Got Here</h2>

<p>Let me rewind a bit. The infrastructure looked textbook-perfect before all this. Strimzi operator managing Kafka on GKE, version 0.43.0, running flawlessly for months. Rock-solid message delivery, zero complaints from application teams, monitoring showing healthy metrics across the board.</p>

<p>Strimzi was the sensible choice. Managing Kafka manually is a nightmare. ZooKeeper coordination, broker configurations, rolling updates, storage management. Why reinvent the wheel when there’s a mature Kubernetes operator that handles all of this? The vendor lock-in was worth it. Or so we thought.</p>

<p>Then GKE decided to auto-upgrade itself to version 1.33.</p>

<p>Nobody noticed at first. Why would we? GKE upgrades happen regularly. Google’s infrastructure is supposed to be reliable. The upgrade completed successfully according to the console. Cluster status green, node health optimal, everything looked normal.</p>

<p>Until the Strimzi operator tried to reconcile its resources.</p>

<p>The failure wasn’t gradual. It was catastrophic. Strimzi operator pods went into CrashLoopBackOff immediately. Every reconciliation loop failed. The operator couldn’t detect the Kubernetes version. Without version detection, it couldn’t manage Kafka resources. Without management, Kafka brokers became orphaned.</p>

<p>Within minutes, the entire Kafka cluster was effectively dead.</p>

<p>Core applications started failing health checks. Message producers couldn’t connect. Consumers stopped processing. Dead letter queues filled up. Circuit breakers tripped across dozens of services. What started as “Kafka is down” cascaded into “half our platform is down.”</p>

<p>The alerts were relentless. PagerDuty, email, Slack, phone calls from on-call engineers, then managers, then directors. Everyone wanted to know what happened and when it would be fixed. The pressure was suffocating.</p>

<p>And I had no answer because I didn’t understand the problem yet.</p>

<h2 id="digging-through-the-wreckage">Digging Through the Wreckage</h2>

<p>First instinct was check the logs. Surely the Strimzi operator is telling us something useful?</p>

<div class="language-plaintext highlighter-rouge"><div class="highlight"><pre class="highlight"><code>ERROR PlatformFeaturesAvailability:138 - Detection of Kubernetes version failed.
io.fabric8.kubernetes.client.KubernetesClientException: An error has occurred.
</code></pre></div></div>

<p>Great. “An error has occurred.” Thanks, Java. Really helpful.</p>

<p>I dug deeper into the stack trace. There’s the real clue, buried twenty lines down.</p>

<div class="language-plaintext highlighter-rouge"><div class="highlight"><pre class="highlight"><code>Caused by: com.fasterxml.jackson.databind.exc.UnrecognizedPropertyException: 
Unrecognized field "emulationMajor" (class io.fabric8.kubernetes.client.VersionInfo), 
not marked as ignorable (9 known properties: "goVersion", "gitTreeState", "platform", 
"minor", "gitVersion", "gitCommit", "buildDate", "compiler", "major"])
</code></pre></div></div>

<p>GKE 1.33 added a new field called <code class="language-plaintext highlighter-rouge">emulationMajor</code> to its version API response. Strimzi’s Kubernetes client library didn’t know how to handle it. Instead of gracefully ignoring unknown fields, it exploded. And when your operator can’t talk to the Kubernetes API properly, your entire Kafka infrastructure becomes unmanageable.</p>

<p>This wasn’t a Kafka problem. This wasn’t even a Strimzi problem. This was a dependency incompatibility introduced by an automatic platform upgrade that nobody had tested against our workloads.</p>

<h2 id="two-terrible-options">Two Terrible Options</h2>

<p>I had two choices, both terrible.</p>

<p>Option A was manual migration. Extract data from the surviving PVCs, spin up a new Kafka cluster, somehow restore topics, partitions, consumer offsets, and ACLs without losing data or breaking every downstream application. In a production environment. While everything is on fire. With no rollback plan.</p>

<p>Option B was fix Strimzi. Somehow make the operator compatible with GKE 1.33, even though we’re running an older version that wasn’t designed for this Kubernetes release.</p>

<p>Option A was high-risk data loss roulette. Kafka’s state is distributed across ZooKeeper and broker storage in complex ways. One wrong move and months of message history could be corrupted or lost. Plus, we’re using Strimzi for a reason. Vendor lock-in means we can’t just export and import like it’s a database dump.</p>

<p>Option B seemed impossible. You don’t just patch compatibility into production operators on the fly. Right?</p>

<p>But Option A would take hours, maybe days, with no guarantee of success. Option B might not work, but if it did, we’d have everything back exactly as it was.</p>

<p>With alerts screaming, applications failing, and stakeholders demanding answers, I chose the impossible option.</p>

<h2 id="the-workarounds-that-failed">The Workarounds That Failed</h2>

<p>The first attempt was the obvious one. Maybe I could force the operator to ignore that problematic field. Jackson has a deserialization feature for exactly this, telling it to not explode when encountering unknown properties.</p>

<p>I added an environment variable to the Strimzi operator deployment.</p>

<div class="language-yaml highlighter-rouge"><div class="highlight"><pre class="highlight"><code><span class="na">env</span><span class="pi">:</span>
  <span class="pi">-</span> <span class="na">name</span><span class="pi">:</span> <span class="s">STRIMZI_JAVA_OPTS</span>
    <span class="na">value</span><span class="pi">:</span> <span class="s2">"</span><span class="s">-Dcom.fasterxml.jackson.databind.DeserializationFeature.FAIL_ON_UNKNOWN_PROPERTIES=false"</span>
</code></pre></div></div>

<p>This should tell Jackson’s ObjectMapper to gracefully ignore fields it doesn’t recognize instead of throwing exceptions. It’s a nuclear option. You’re basically telling your deserializer “I don’t care what’s in the JSON, just give me what you understand” but desperate times call for desperate measures.</p>

<p>Deployed it. Watched the logs with hope.</p>

<p>Same error. The JVM option wasn’t being picked up correctly, or the failure was happening in a context where this configuration didn’t apply. Either way, the operator still couldn’t detect the Kubernetes version.</p>

<p>Next attempt. Maybe I could bypass version detection entirely. If the operator can’t detect the version automatically, what if I just tell it what version to use?</p>

<div class="language-yaml highlighter-rouge"><div class="highlight"><pre class="highlight"><code><span class="na">env</span><span class="pi">:</span>
  <span class="pi">-</span> <span class="na">name</span><span class="pi">:</span> <span class="s">STRIMZI_KUBERNETES_VERSION</span>
    <span class="na">value</span><span class="pi">:</span> <span class="s2">"</span><span class="s">1.28"</span>
</code></pre></div></div>

<p>The idea was to force Strimzi to think it’s running on Kubernetes 1.28, a version it definitely knows how to handle. Skip the problematic version detection API call altogether.</p>

<p>I applied the change. The operator started. Logs looked promising at first. Then everything went sideways again.</p>

<div class="language-plaintext highlighter-rouge"><div class="highlight"><pre class="highlight"><code>WARN PlatformFeaturesAvailability:156 - Forced Kubernetes version 1.28 differs from detected version
ERROR KafkaAssemblyOperator:112 - Reconciliation failed: API version mismatch
</code></pre></div></div>

<p>Strimzi was still trying to detect the actual version despite being told to use 1.28. The forced version created a conflict rather than a workaround. The operator detected the mismatch and refused to proceed, probably as a safety mechanism to prevent running with incorrect API assumptions.</p>

<p>Two attempts, two failures. The workarounds that should have worked in theory were hitting edge cases in practice. At this point, I’m several hours into the incident. The phone calls have escalated. People are asking if we need to declare a major outage. Application teams are demanding ETAs I can’t give them.</p>

<p>I had to go deeper. No more clever workarounds. Time to understand what was actually broken and fix it at the source.</p>

<h2 id="reading-source-code-at-2-am">Reading Source Code at 2 AM</h2>

<p>Out of desperation, I did what probably should have been my first move. I cloned the Strimzi repository and started reading source code.</p>

<p>Not the documentation. Not GitHub issues. The actual implementation.</p>

<p>I traced through the PlatformFeaturesAvailability class, following the exact code path that was failing. The logic was straightforward enough. Call Kubernetes API, deserialize version info, detect platform capabilities. The failure happened during deserialization when Jackson encountered a field it didn’t recognize.</p>

<p>Then I checked what the latest Strimzi version was using. Version 0.46.0 had just been released, and it worked fine with newer GKE versions. What were they using?</p>

<div class="language-xml highlighter-rouge"><div class="highlight"><pre class="highlight"><code><span class="nt">&lt;fabric8.kubernetes-client.version&gt;</span>7.2.0<span class="nt">&lt;/fabric8.kubernetes-client.version&gt;</span>
</code></pre></div></div>

<p>Version 7.2.0. A major version jump from our current 6.13.4.</p>

<p>Here’s where it gets interesting. I couldn’t just upgrade to Strimzi 0.46.0 directly. Our Kafka cluster was still ZooKeeper-based, not yet migrated to KRaft mode. Strimzi’s upgrade path had compatibility requirements. You can’t just jump from 0.43.0 to 0.46.0 with a production Kafka cluster that has months of state.</p>

<p>But what if I backported the dependency fix?</p>

<p>What if I took Strimzi 0.43.0’s source code and simply updated the fabric8 libraries to version 7.2.0?</p>

<p>It was a desperate idea. Dependency upgrades can introduce breaking changes. API incompatibilities. Behavioral differences. This could make things worse. But at this hour with everything on fire, desperate ideas start looking reasonable.</p>

<h2 id="building-a-custom-operator-in-production">Building a Custom Operator in Production</h2>

<p>I modified the pom.xml.</p>

<div class="language-xml highlighter-rouge"><div class="highlight"><pre class="highlight"><code><span class="nt">&lt;fabric8.kubernetes-client.version&gt;</span>7.2.0<span class="nt">&lt;/fabric8.kubernetes-client.version&gt;</span>
<span class="nt">&lt;fabric8.openshift-client.version&gt;</span>7.2.0<span class="nt">&lt;/fabric8.openshift-client.version&gt;</span>
<span class="nt">&lt;fabric8.kubernetes-model.version&gt;</span>7.2.0<span class="nt">&lt;/fabric8.kubernetes-model.version&gt;</span>
<span class="nt">&lt;fabric8.zjsonpatch.version&gt;</span>0.3.0<span class="nt">&lt;/fabric8.zjsonpatch.version&gt;</span>
</code></pre></div></div>

<p>The progression I’d tried was revealing. Version 6.13.4 was the original that failed with the <code class="language-plaintext highlighter-rouge">emulationMajor</code> error. Version 6.14.0 was my first attempt but still failed, the minor version bump wasn’t enough. Version 7.2.0 was from Strimzi 0.46.0, the nuclear option.</p>

<p>I kicked off the Maven build. Waited through compilation, unit tests, integration tests. Every failed test made my stomach drop. Every successful test gave me a sliver of hope.</p>

<p>The build completed successfully.</p>

<p>I pushed the image to our container registry, updated the deployment manifest, applied it to the cluster.</p>

<p>The operator pod started. Logs began flowing. I held my breath, waiting for that familiar error message.</p>

<div class="language-plaintext highlighter-rouge"><div class="highlight"><pre class="highlight"><code>INFO PlatformFeaturesAvailability:124 - Kubernetes version: 1.33.0-gke.3000
INFO KafkaAssemblyOperator:89 - Reconciliation started for Kafka cluster kafka-cluster
</code></pre></div></div>

<p>It worked.</p>

<p>The operator detected the Kubernetes version. Reconciliation loops began. Within minutes, Kafka brokers were healthy again. Services reconnected. Message backlogs started processing. Health checks turned green.</p>

<p>The alerts stopped.</p>

<p>Fun fact, I didn’t sleep that night. Not because I was still troubleshooting, but because the adrenaline wouldn’t let me. Yeah, this is real DevOps life I guess.</p>

<h2 id="understanding-what-actually-broke">Understanding What Actually Broke</h2>

<p>Let me break down the technical reality of what just destroyed our production infrastructure.</p>

<p>GKE 1.33 introduced a new field in their Kubernetes version API response called <code class="language-plaintext highlighter-rouge">emulationMajor</code>. This field helps GKE communicate version emulation details for compatibility purposes. Perfectly reasonable addition to their API.</p>

<p>Strimzi 0.43.0 used fabric8 Kubernetes client version 6.13.4. This library included a Java class called <code class="language-plaintext highlighter-rouge">VersionInfo</code> that mapped Kubernetes version API responses to strongly-typed objects. That class expected specific fields like <code class="language-plaintext highlighter-rouge">major</code>, <code class="language-plaintext highlighter-rouge">minor</code>, <code class="language-plaintext highlighter-rouge">gitVersion</code>, <code class="language-plaintext highlighter-rouge">buildDate</code>, and so on.</p>

<p>When the 6.13.4 client received a response containing <code class="language-plaintext highlighter-rouge">emulationMajor</code>, Jackson’s ObjectMapper, the library handling JSON deserialization, threw an <code class="language-plaintext highlighter-rouge">UnrecognizedPropertyException</code> because the <code class="language-plaintext highlighter-rouge">VersionInfo</code> class didn’t have a field for it.</p>

<p>The exception propagated up through Strimzi’s platform detection logic, causing every reconciliation loop to fail. Without successful reconciliation, the operator couldn’t manage Kafka resources. Kafka brokers became orphaned, unable to receive configuration updates or handle failures.</p>

<p>The fix in fabric8 7.2.0 was likely simple. Either adding <code class="language-plaintext highlighter-rouge">@JsonIgnoreProperties(ignoreUnknown = true)</code> to the <code class="language-plaintext highlighter-rouge">VersionInfo</code> class or explicitly adding the <code class="language-plaintext highlighter-rouge">emulationMajor</code> field. This is a single-line change in the library’s source code, but it made the difference between a working Kafka cluster and complete infrastructure failure.</p>

<h2 id="the-real-problem-wasnt-technical">The Real Problem Wasn’t Technical</h2>

<p>Here’s what makes this story terrifying. The technical problem, dependency incompatibility, was completely predictable and preventable. But we never had a chance to prevent it because GKE auto-upgraded itself without warning.</p>

<p>Think about what auto-upgrade actually means in practice.</p>

<p>Your cloud provider decides when your infrastructure changes. Not during planned maintenance windows. Not after testing in staging environments. Not when your team is prepared. Whenever the provider’s release schedule decides it’s time.</p>

<p>The upgrade happens atomically from your perspective. One moment you’re running Kubernetes 1.32, the next you’re on 1.33. No rollback plan, no testing window, no chance to validate workload compatibility.</p>

<p>Breaking changes in Kubernetes APIs can cascade through your entire stack. It’s not just about pods and services. Every operator, every controller, every application that talks to the Kubernetes API is potentially affected.</p>

<p>In our case, GKE 1.33’s <code class="language-plaintext highlighter-rouge">emulationMajor</code> field broke Strimzi. But it could have been anything. Istio service mesh failing to configure routing rules due to API changes, breaking service-to-service communication across your entire platform. ArgoCD unable to sync applications, freezing your entire GitOps deployment pipeline with no way to rollback or deploy fixes. Cert-manager failing to renew certificates, leading to cascading TLS failures as certificates expire. Prometheus Operator unable to scrape metrics, leaving you blind during an incident. External DNS controller breaking, making services unreachable as DNS records stop updating.</p>

<p>Any of these failures could trigger the same cascade we experienced with Kafka. One broken operator leading to application failures, alerting storms, and engineers scrambling to fix infrastructure in the middle of the night.</p>

<h2 id="counting-the-real-cost">Counting the Real Cost</h2>

<p>The Kafka outage rippled through our entire platform. But the real cost wasn’t just downtime metrics.</p>

<p>Revenue impact was brutal. Every service depending on Kafka for async communication was degraded or down. Transaction processing stopped. User notifications failed. Analytics data wasn’t being collected. Calculate those hours against revenue per minute and the number gets uncomfortable fast.</p>

<p>Engineering cost added up quickly. Multiple teams dropped everything to respond. On-call engineers, platform team, application teams trying to understand why their services broke. Call it 15 engineers at an average loaded cost of $150 per hour for 6 hours. That’s $13,500 just in incident response labor.</p>

<p>Opportunity cost was harder to measure but just as real. Those engineers weren’t working on planned features, bug fixes, or improvements. Multiply lost development time across teams and the real cost becomes staggering.</p>

<p>Trust erosion started immediately. Application teams relying on our platform infrastructure lost confidence. Conversations about migrating to managed services started. Engineers questioned whether our operator-based approach was sustainable.</p>

<p>Stress and burnout hit everyone involved. I didn’t sleep that night. Neither did several other engineers. The psychological toll of high-pressure incidents adds up over time, contributing to burnout in ways that don’t show up in incident postmortems.</p>

<p>And all of this could have been prevented by a single configuration setting. Disable auto-upgrade.</p>

<h2 id="this-keeps-happening">This Keeps Happening</h2>

<p>This wasn’t an isolated incident. The pattern repeats across infrastructure stacks and workloads.</p>

<p>Different orchestration platforms, different applications, different protocols, but identical fundamental failure mode. Platform auto-upgrade introducing breaking changes that cascade through operator-managed workloads.</p>

<p>Modern infrastructure runs on operators and controllers. Whether you’re running Kubernetes with custom operators, service mesh with control planes, or database clusters with automated management, you’re running distributed systems that make assumptions about platform APIs.</p>

<p>When those APIs change without testing, operators break. When operators break, the applications they manage become unmanageable. When management fails during peak load, cascading failures destroy availability.</p>

<p>The irony is that we’ve built incredibly sophisticated application-layer resilience. Circuit breakers, graceful degradation, chaos engineering. But we’ve left a massive vulnerability at the platform layer by enabling auto-upgrade.</p>

<h2 id="what-this-says-about-how-we-build">What This Says About How We Build</h2>

<p>This pattern reveals something uncomfortable about how we approach infrastructure in the cloud-native era.</p>

<p>We’ve become incredibly comfortable delegating control to cloud providers. “Managed services” sounds great until you realize “managed” means “we decide when and how things change, not you.”</p>

<p>Infrastructure maturity isn’t just about adopting the latest orchestration platform or implementing sophisticated monitoring. It’s about understanding where control matters and being willing to take on operational burden to maintain that control.</p>

<p>For non-critical workloads, auto-upgrade makes sense. Let the provider handle it. Focus your energy elsewhere.</p>

<p>For production systems where downtime costs thousands per minute, auto-upgrade is an unacceptable risk. The convenience isn’t worth the blast radius when something breaks.</p>

<h2 id="questions-you-should-be-asking">Questions You Should Be Asking</h2>

<p>Next time you’re architecting infrastructure, think about these things.</p>

<p>Who controls when your infrastructure changes? If the answer is “our cloud provider,” you’ve outsourced not just operations but risk management to a party that doesn’t understand your workloads, your peak traffic patterns, or your business criticality.</p>

<p>What breaks when platform APIs change? Every operator, controller, and integration in your stack makes assumptions about API behavior. You need to list them out. Then ask how you’d test compatibility before upgrading.</p>

<p>Can you rollback a platform upgrade? If your cloud provider upgrades your Kubernetes cluster and something breaks, what’s your rollback plan? Most platforms don’t support rollback. Your only option is forward, fixing compatibility issues under pressure while services are failing.</p>

<p>What’s the blast radius of a compatibility failure? In our case, one operator failure took down Kafka, which cascaded through dozens of services. You need to map your dependencies. Understand what breaks when platform-level components fail.</p>

<p>Are you optimizing for convenience or reliability? Auto-upgrade is convenient. Manual upgrade with proper testing is reliable. You have to choose which matters more for each workload.</p>

<p>How would you debug this failure at 3 AM? When logs just say “version detection failed” and your entire message queue is down, do you have the skills, access, and documentation to trace through operator source code and rebuild custom images? Or are you dead in the water?</p>

<h2 id="preventing-this-nightmare">Preventing This Nightmare</h2>

<p>Here’s what you should be doing instead of enabling auto-upgrade.</p>

<p>First, disable auto-upgrade for production. Your GKE cluster configuration should have release channel set to NONE, not RAPID or REGULAR. Maintenance policy should have auto-upgrade set to false. Manual control over upgrades. Auto-repair for nodes is fine, that’s different, but auto-upgrade needs to be off.</p>

<p>Second, implement staged rollouts. Dev environment gets upgraded first. Then staging with production-like workloads. Then canary production cluster with subset of traffic. Monitor for 48 to 72 hours before full rollout. Only do full production upgrade during scheduled maintenance windows.</p>

<p>Third, maintain a compatibility matrix. Document every operator, controller, and platform integration. Current versions, Kubernetes API versions they depend on, known compatibility issues, upgrade testing checklist. Keep this updated.</p>

<p>Fourth, test before upgrading. Create a test cluster matching production. Same Kubernetes version target, same operators and controllers, representative workload patterns. Run for 24 hours minimum. Monitor for any failures or warnings. If the test cluster breaks, production would have broken too.</p>

<p>Fifth, have rollback plans. Since most cloud platforms don’t support cluster version rollback, you need alternatives. Keep previous cluster as standby. Document migration procedures. Test failover regularly. Understand recovery time objectives.</p>

<p>Sixth, monitor API deprecation warnings. Set up alerts for deprecated API usage in your workloads, operator compatibility announcements, platform upgrade schedules, breaking changes in release notes. Be proactive about this.</p>

<p>Seventh, build operational capability. Ensure your team can read operator source code, build custom operator images if needed, debug platform-level issues, make infrastructure decisions under pressure. These skills matter when everything is on fire.</p>

<h2 id="what-google-knows">What Google Knows</h2>

<p>Here’s the part that should make every infrastructure engineer reconsider their defaults.</p>

<p>Google builds GKE. They operate it at massive scale. They have world-class SRE teams and decades of distributed systems experience.</p>

<p>And they offer a “No channel” option for release management. Manual control over every upgrade.</p>

<p>If Google, with their expertise and resources, provides manual control as an option, what does that tell us about the risks of auto-upgrade?</p>

<p>They understand the trade-offs. Automatic upgrades reduce toil but increase risk. For workloads where reliability matters more than operational convenience, manual control isn’t optional. It’s essential.</p>

<h2 id="the-uncomfortable-reality">The Uncomfortable Reality</h2>

<p>Modern infrastructure has incredible capabilities. We orchestrate thousands of containers, route traffic with millisecond precision, replicate data globally, and handle failures gracefully.</p>

<p>But we’ve convinced ourselves that this complexity can be managed with “set it and forget it” automation. That cloud providers can safely upgrade our infrastructure without coordination. That platform APIs are stable enough that we don’t need to test compatibility.</p>

<p>The Kafka outage proved otherwise. Hours of downtime, thousands in impact, and one sleepless night, all because we enabled a checkbox that said “automatically keep my cluster updated.”</p>

<p>The uncomfortable truth is that infrastructure reliability requires control. Control over when changes happen. Control over testing before production deployment. Control over recovery when things go wrong.</p>

<p>Auto-upgrade is convenient until it’s catastrophic.</p>

<p>Maybe the question isn’t whether cloud platforms should offer auto-upgrade features. Maybe the question is why we keep enabling them in production environments where we can’t afford the risk.</p>

<h2 id="the-technical-debt-that-follows">The Technical Debt That Follows</h2>

<p>The solution, backporting a dependency update into Strimzi’s source code, worked. But think about what that implies.</p>

<p>I reverse-engineered a production failure, identified the incompatible library version, modified open-source software’s dependency tree, built custom operator images, and deployed them to production. All without vendor support, official documentation, or any guarantee it wouldn’t make things worse.</p>

<p>This is what “fixing” a dependency incompatibility looks like when auto-upgrade takes choice away from you.</p>

<p>We got lucky. The fabric8 library upgrade was backward-compatible enough that Strimzi worked. But it could easily have introduced subtle bugs that wouldn’t surface until later. API behavior changes, memory leaks, concurrency issues.</p>

<p>Now we’re running a forked version of Strimzi that isn’t officially supported. Future upgrades require manually merging our changes. Security patches need custom rebuilds. We’ve traded one vendor lock-in, Strimzi operators, for a worse one, custom-built unsupported operators.</p>

<p>This is the real cost of auto-upgrade failures. Not just the immediate downtime, but the technical debt that follows. The custom workarounds. The unsupported configurations. The increasing fragility as your infrastructure drifts further from standard deployments.</p>

<p>And it all started with a checkbox nobody thought twice about enabling.</p>

<p>The next time you’re setting up a production Kubernetes cluster and you see that “Enable auto-upgrade” option, remember this story. Remember the alerts, the cascading failures, the hours of debugging, the custom builds, the technical debt.</p>

<p>Remember that sometimes the best technology decision is the one that gives you the power to say “not yet.”</p>

<p>Because when your Kafka cluster vanishes in the middle of the night over an upgrade nobody approved, you’ll wish you had that power back.</p>

<p>When distributed systems eat themselves over an auto-upgrade nobody thought to question, it’s worth remembering that “managed” doesn’t mean “maintenance-free.” It means someone else decides when your infrastructure breaks.</p>

<p>Choose wisely who gets that control.</p>]]></content><author><name>Angga Suriana</name></author><category term="gke" /><category term="kubernetes" /><category term="kafka" /><summary type="html"><![CDATA[A Sunday night GKE auto-upgrade wiped out an entire Kafka cluster. A detailed breakdown of what went wrong and why automated maintenance windows need more respect.]]></summary></entry></feed>